White Space Analysis Starts With the Clients You Already Have
TL;DR
Two expensive problems happen after the lead converts, where a lot of B2B reporting has stopped looking. Existing clients research services they don't buy from you and take the work elsewhere. Deals reach a verbal yes, then stall. Adobe Customer Journey Analytics (CJA) B2B Edition can show both once your CRM data shares a timeline with everything else your buyers do.
Here's what's inside.
- How white space analysis finds cross-sell in your existing accounts
- Where deals stall, and why pipeline velocity can't tell you
- How to put a number on both leaks and where to start in the playbook
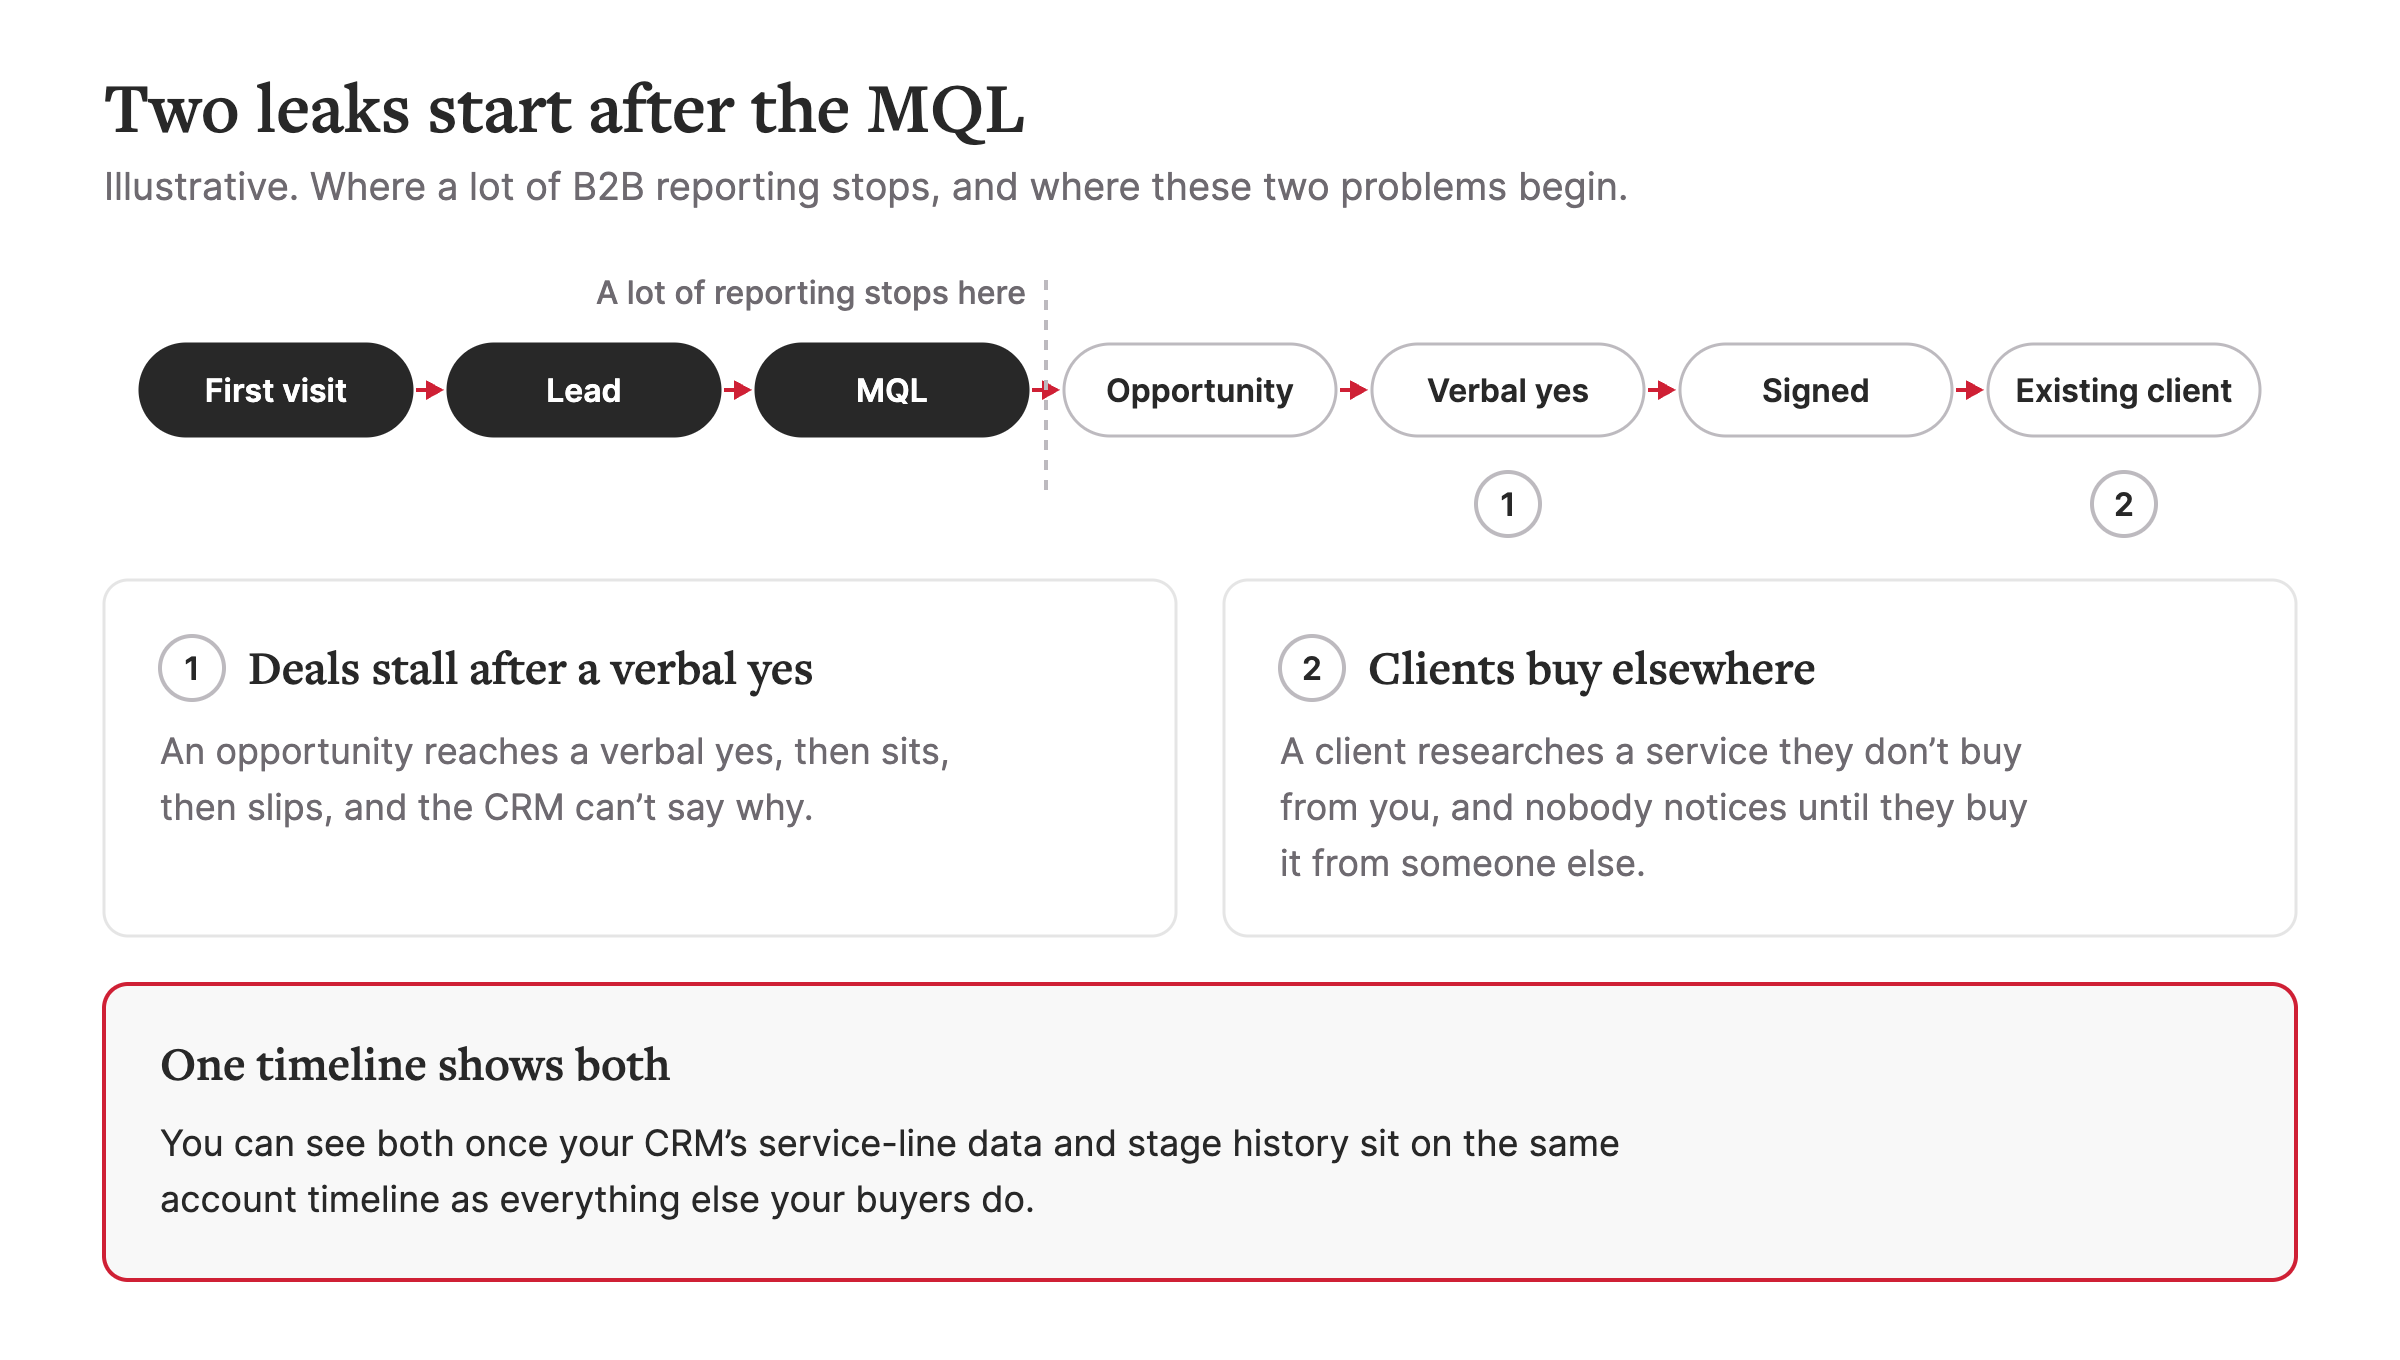
Customer Journey Analytics (CJA) B2B Edition can follow an account from first visit through opportunity and close. But a lot of B2B reporting still stops at the MQL, right before two expensive leaks begin.
The first shows up in white space analysis, the work of finding services an existing client could buy from you but doesn't. A client's team researches one of those services, and nobody notices until they buy it from someone else. The second is the stalled deal. An opportunity reaches a verbal yes, then sits, then slips, and the CRM can't say why. You can see both once your CRM's service-line data and stage history sit on the same account timeline as everything else your buyers do.
Our first post in this series, Your sales cycle isn't just the web anymore, covered the front half of the buying journey, from anonymous visitors to buying groups. This one picks up after the lead converts. Both draw on Northern's B2B analytics playbook and on what Adobe's Matt Coers showed in our Nov 18 webinar, Your Sales Cycle Isn't Just the Web Anymore.
How white space analysis finds cross-sell in existing accounts
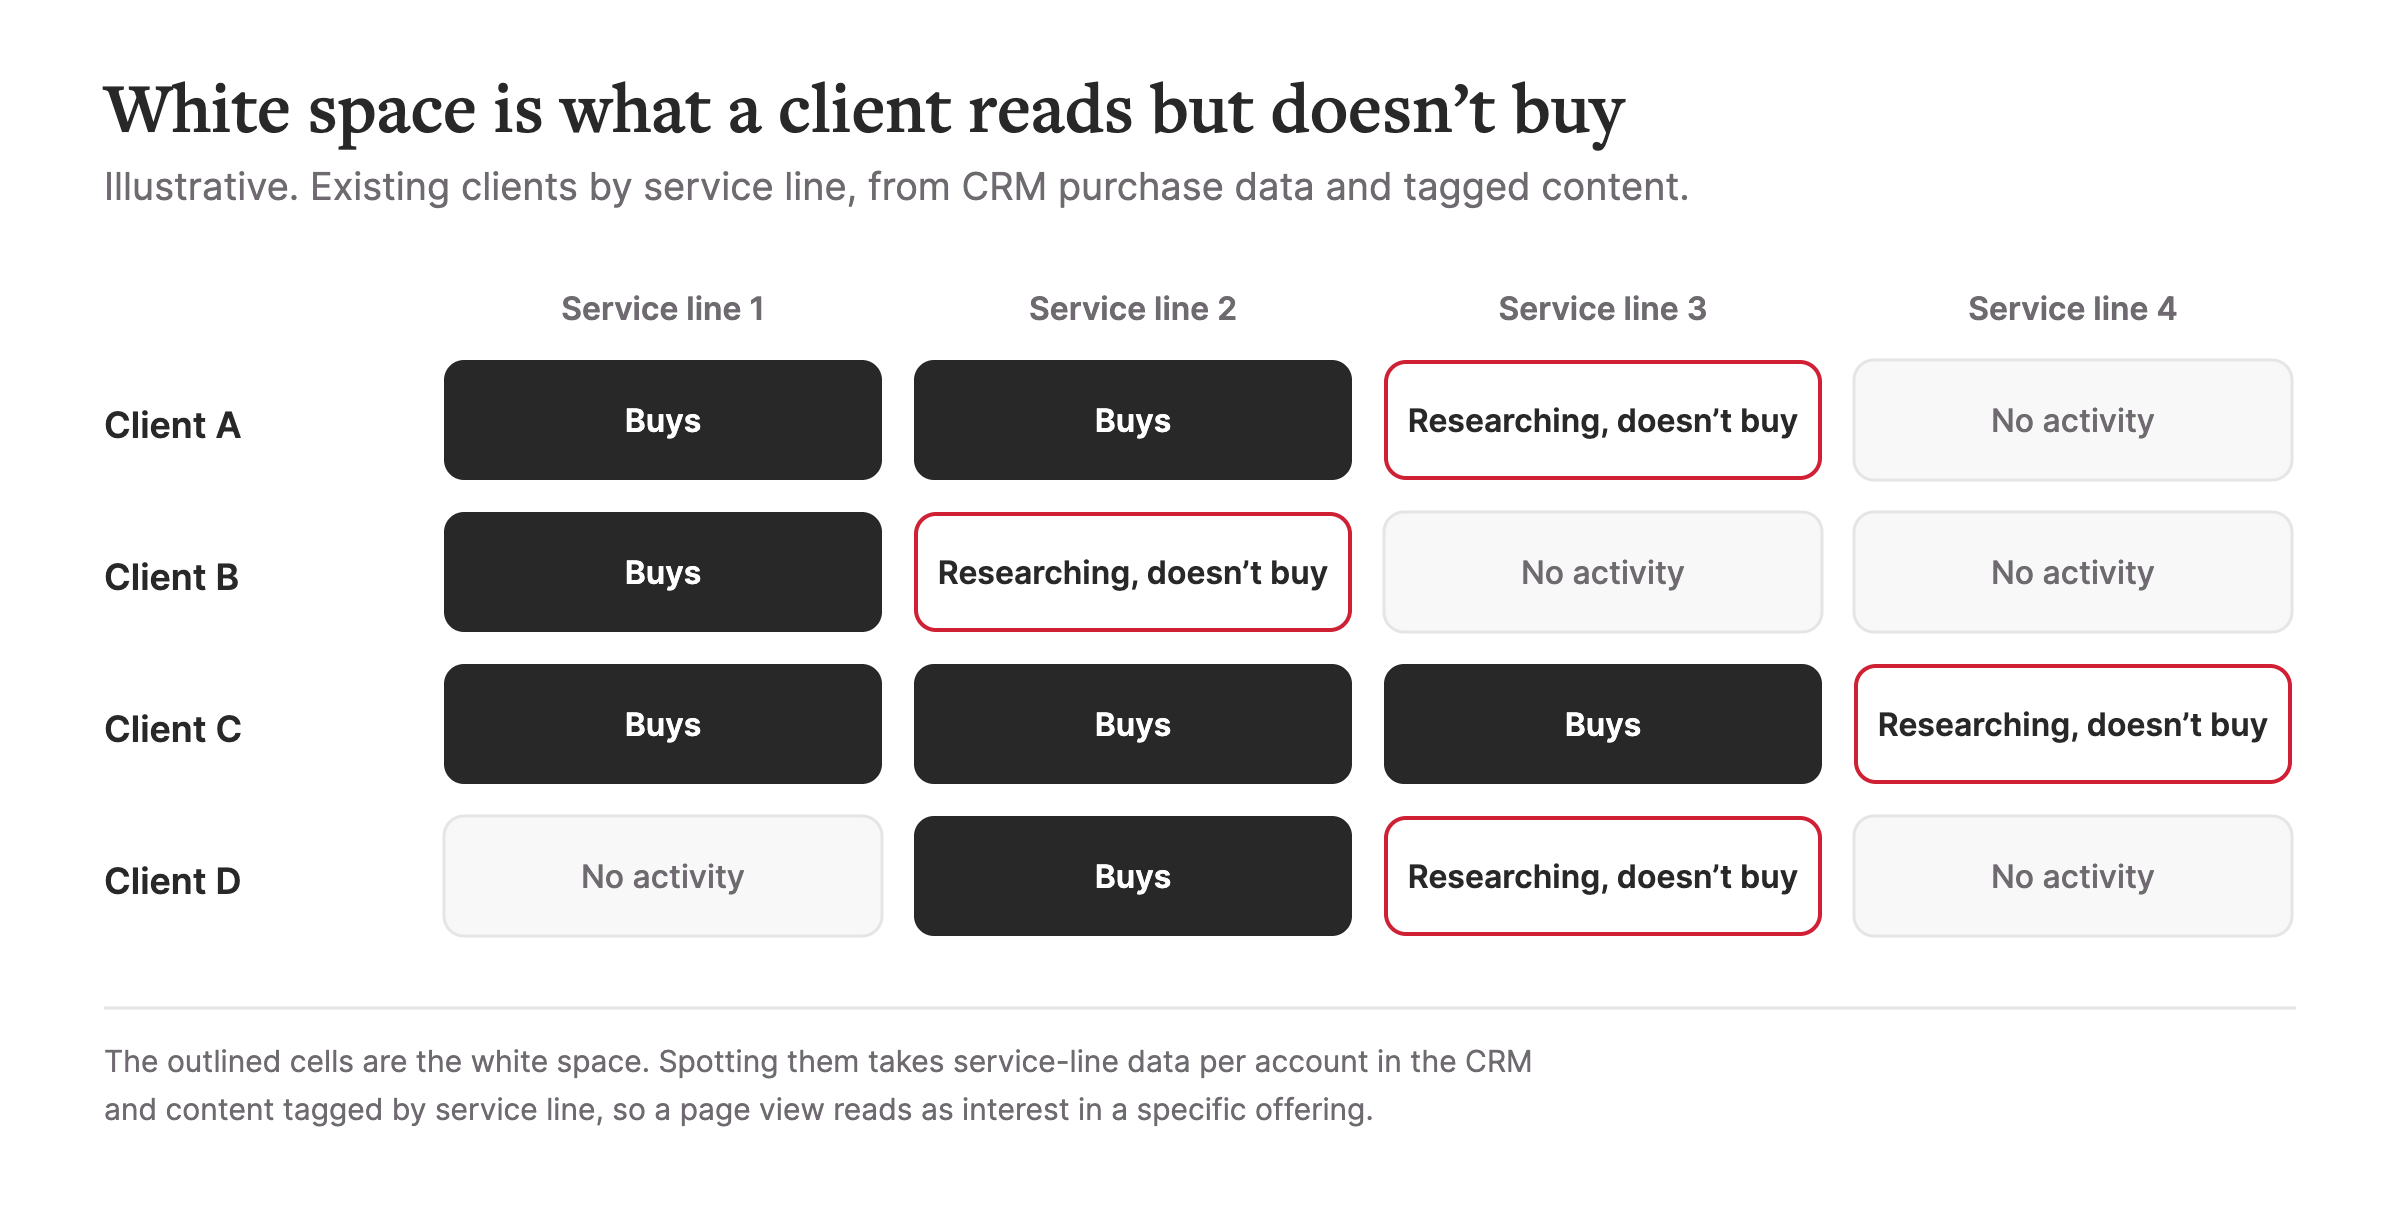
White space analysis is the practice of finding products or services an existing client could buy from you but doesn't yet. It's often run from a spreadsheet of who buys what, or from third-party intent and technographic data about each account.
For professional services and multi-product firms, some of the best growth comes from clients who already trust you. But in web analytics, a client reading about a service they don't buy from you looks like any other visitor. Nobody finds out until the work goes to a competitor.
That interest is already in your own data. When people at an existing client read your service pages, case studies, and guides for an offering they don't buy, that's first-party intent data, and it comes straight from the account.
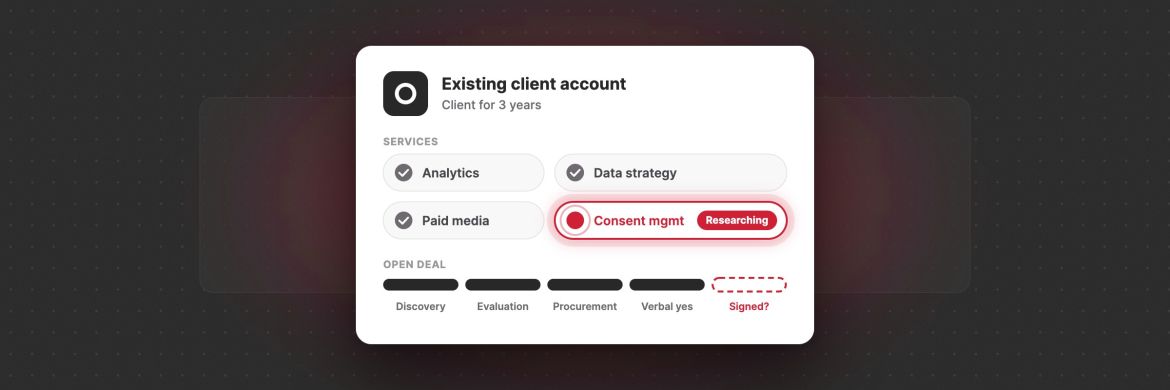
Say you're a professional services firm, and a client has bought your analytics work for three years. Over six weeks, four people from that client read your consent management pages and download a privacy guide. Nobody on the account team hears about it. In February, the client signs a consent project with another firm.
Spotting it takes three things, in any analytics stack.
- Clean data in your CRM about which products or service lines each client buys. This is usually the slowest part.
- Content tagged by service line, so a page view reads as interest in a specific offering.
- A defined play, meaning who gets alerted, what they do, and what the client sees next.
Customer Journey Analytics B2B Edition supports this analysis at the account level. With CRM account data and tagged content in the same view, you can build a segment of existing clients engaging with a service line they don't buy, then size it, track it over time, and share it with account teams. Adobe's B2B Edition use case for account marketing lists upsell and cross-sell opportunities among the things to analyze.
In the Nov 18 webinar, Matt Coers, Principal Solutions Consultant at Adobe, showed the account side of this in CJA. He brought account data in from the CRM, broke leads down by industry, and looked at which job titles inside those accounts were taking meetings.
Getting that segment in front of the right people is a separate step. With Real-Time CDP, in either the standard or B2B edition, you can send those audiences to LinkedIn automatically. Without it, you export the audience from CJA and upload it by hand, which is a reasonable way to start while you prove the signal works.
The CRM data has to be right first. If your CRM can't reliably say which services each client already buys, the segment will eventually tell an account manager to pitch something the client has had for years. After that happens once, account managers stop opening the list.
A good first check is whether your CRM records which products or service lines each client buys. If it can't, fix that before you build any cross-sell segment.
Pipeline velocity hides where deals stall
Pipeline velocity measures how quickly opportunities move through your pipeline and turn into revenue. The usual formula multiplies the number of opportunities by average deal size and win rate, then divides by the length of the sales cycle. Deal velocity applies the same idea to a single deal or a smaller group of deals.
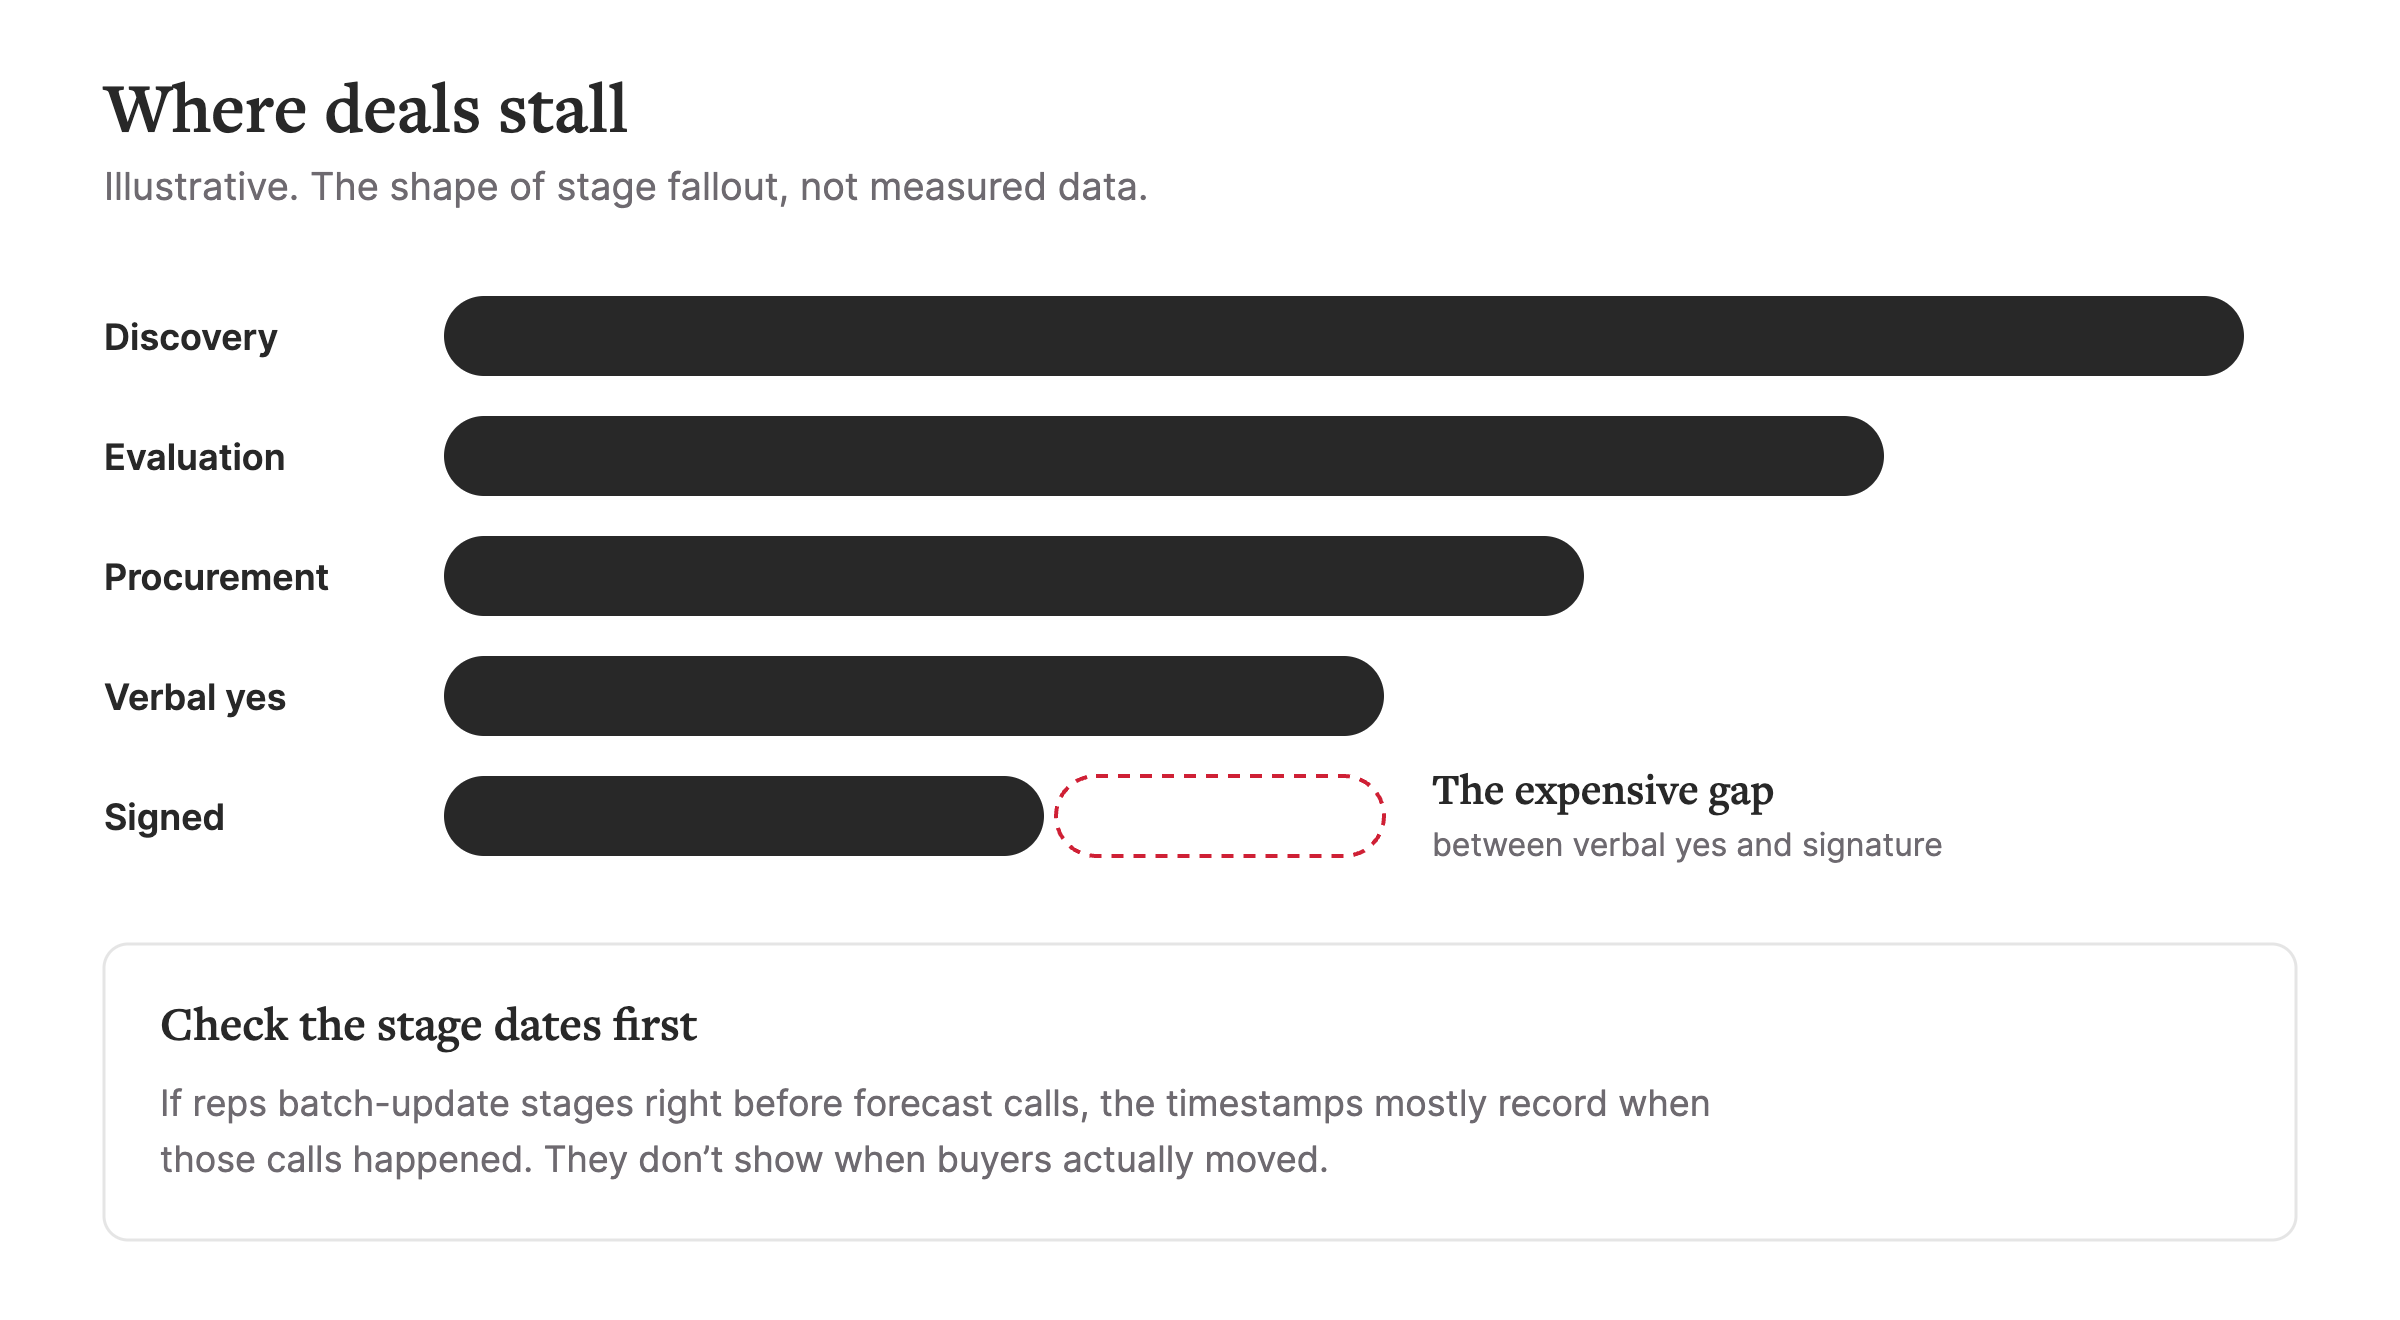
The formula gives you one speed for the whole pipeline. It can't tell you where deals slow down. Some stall in discovery. Others die in procurement, or sit for weeks between a verbal yes and a signed contract. Sales and marketing usually both have a theory, but CRM stages and marketing engagement rarely share a timeline, so nobody can check.
Say a manufacturer's deal reaches a verbal yes in March. Procurement asks for new security paperwork, the champion goes on leave, and the CRM still shows "Verbal yes" in July. The pipeline report counts it as late-stage the whole time. What it can't show is that nobody from the account has opened an email or visited the site since April.
Plenty of deals never go to a competitor at all. Matt Dixon and Ted McKenna analyzed about 2.5 million recorded sales calls for their book The JOLT Effect and found that 40 to 60% of all deals end in no decision.
Seeing where deals stall needs the full history of stage changes as time-stamped events, joined to the same account and opportunity as every marketing touch. It also needs a working definition of "stalled," such as no stage movement in a set number of days.
In CJA B2B Edition, the Opportunity container works with the Cohort table, Fallout, Flow, and Journey canvas visualizations. Adobe's documentation example groups opportunities into monthly cohorts by when they were created, then tracks how many reach Closed-Won, to compare how fast groups of deals move. With stage history and engagement on one timeline, you can see what happened before a deal moved forward, and what went quiet before one was lost.
A stall with one engaged contact is a different problem from a stall where the whole buying committee has gone quiet. Our first post covers buying groups in more depth. In the Nov 18 demo, Matt ran a fallout report with opportunities as the unit instead of accounts, since one account can have deals at different stages. Almost every opportunity made it through discovery, and the drop-off started at the solution presentation stage. Filtering that stage by job title showed procurement managers and logistics coordinators doing most of the engaging. Procurement managers leaned toward testimonials, while site engineers went to case studies and documentation. That was Adobe's demo data, but the method carries over to your own pipeline.
Stage data comes with its own catch. If reps batch-update their opportunity stages right before forecast calls, the timestamps mostly record when those calls happened. They don't show when buyers actually moved. Fixing that is a sales leadership decision, and analytics can only show you where the data is slipping.
A good first step is to agree on what "stalled" means for your team. Then ask sales leadership whether the stage dates in your CRM can be trusted.
“If three or more of [these challenges] sound familiar to you, you do not have a tool problem. You have a connection problem.”
— Li Evans, Northern
Put a number on both leaks before you build anything
Both problems are easier to fund once they have a dollar figure attached, and you can estimate each one with numbers you probably already have.
| Leak | Your inputs | What you get |
|---|---|---|
| Cross-sell lost to competitors | Clients who bought a service elsewhere, per year × average contract value | Cross-sell revenue lost |
| Deals lost after a verbal yes | Deals lost after a verbal yes, per year × average deal value | Late-stage revenue lost |
These are estimates to size the problem for an internal business case. They aren't a forecast or a promised return. The full worksheet in the playbook adds three more rows, for paid media reaching existing customers, manual pipeline reporting, and brand spend that isn't tied to pipeline.
How to use the B2B analytics playbook
The playbook, Your sales cycle isn't just the web anymore, covers 10 B2B analytics challenges and how to fix them with Adobe Customer Journey Analytics B2B Edition. You don't need to read all 10. Start with the challenge index, check the statements your team would recognize, and jump to those chapters.
The challenges sit in three layers. Identity (challenges 1 to 3) comes first, since you can't measure what you can't connect. Measurement (4 to 8) is next. Activation (9 and 10) turns what you've measured into something your teams do differently.
Each chapter covers the problem, what it takes in any stack, how CJA B2B Edition handles it, what to measure, the catch that rarely comes up in a sales pitch, and one first step. The playbook also sorts the work into crawl, walk, and run stages. Stalled deals (challenge 8) is a walk-stage problem, once your web and CRM data are connected. Cross-sell (challenge 10) sits in the run stage, since it depends on service-line data and activation.
Get the playbook · Watch the on-demand webinar
A lot of B2B analytics work goes into the front half of the buying journey, from first visit to MQL. The back half is where clients and deals slip away without anyone noticing. For a quick read on where your team stands, the B2B Analytics Scorecard takes about five minutes and gives you a score, your top three gaps, and a first step.
Need help with stalled deals or missed cross-sell? Our analytics team can help you sort out what your CRM and analytics already capture, and what it would take to connect them. We'd love to continue the conversation.
Frequently asked questions
What is white space analysis?
White space analysis is the practice of finding products or services an existing client could buy from you but doesn't yet. In B2B, it compares what each account already buys with the services it's showing interest in. Teams use it to plan cross-sell and account expansion.
What is pipeline velocity?
Pipeline velocity measures how quickly opportunities move through a sales pipeline and turn into revenue. It's usually calculated as the number of opportunities, multiplied by average deal size and win rate, divided by the length of the sales cycle.
What does deal velocity mean?
Deal velocity is how quickly a single deal, or a group of deals, moves from opportunity to close. It uses the same inputs as pipeline velocity, applied to a narrower set of opportunities.
Can Adobe Customer Journey Analytics track opportunity stages?
Yes. Customer Journey Analytics B2B Edition adds an Opportunity container, and the Cohort table, Fallout, Flow, and Journey canvas visualizations support it. Stage changes need to come in from your CRM as time-stamped events. B2B Edition is sold as its own service or as an add-on to Customer Journey Analytics.
Stay informed, sign up for our newsletter.