Your Sales Cycle Isn't Just the Web Anymore

Author
Li Evans
Senior Manager, Analytics & Customer Journey
TL;DR
Most web analytics platforms count individual visitors over short lookback windows. B2B deals involve buying groups, run for months, and cross channels your website never sees. Measuring them takes account-level data, connected systems, and definitions that marketing, sales, and finance agree on.
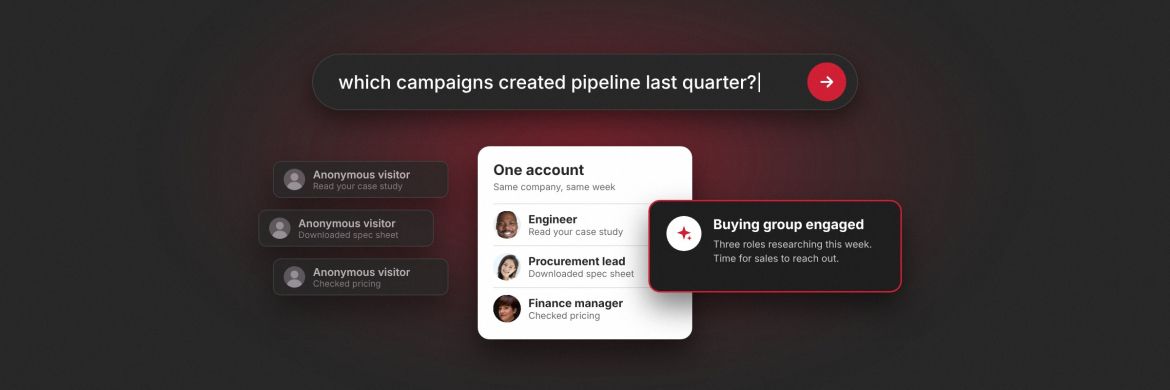
You've probably sat through this scenario before. Someone on the leadership team asks which campaigns created pipeline last quarter, and the room gets as quiet as a sales floor at 4:55 on a Friday.
Eventually, somebody volunteers to pull the numbers. A week later, after exports from LinkedIn and Google, a download from the marketing automation platform, an opportunity report from the CRM, and a web analytics dashboard, there's a spreadsheet. But nobody fully trusts it. Sales thinks marketing is taking too much credit. Finance thinks everyone is just guessing. And then next quarter's budget gets built on it anyway.
If that sounds familiar, I want you to hear this clearly: it's not because your team isn't smart enough. It's because your analytics was built to measure shoppers, and you sell to committees.
Most analytics was built for one buyer and a quick sale
Most web analytics platforms were built around a consumer model. One person shows up, looks around, and buys or doesn't within the span of a few days. That works for products like a pair of sneakers or a hiking jacket. It starts to fall apart when a purchase involves a buying committee, a procurement review, security checks, and a sales cycle measured in quarters.
According to Gartner, a typical complex B2B purchase involves six to ten decision makers, and buyers spend only about 17% of their purchase time meeting with potential suppliers. The rest happens on your website, in your content, at your events, in conversations with peers, and in places you can't see at all.
Your sales cycle isn't just on the web anymore. So why is your analytics still only watching your website?
Four reasons B2B marketing analytics breaks
When I work with B2B teams on their measurement, the same four mismatches show up again and again. None of them get fixed with a shinier dashboard.
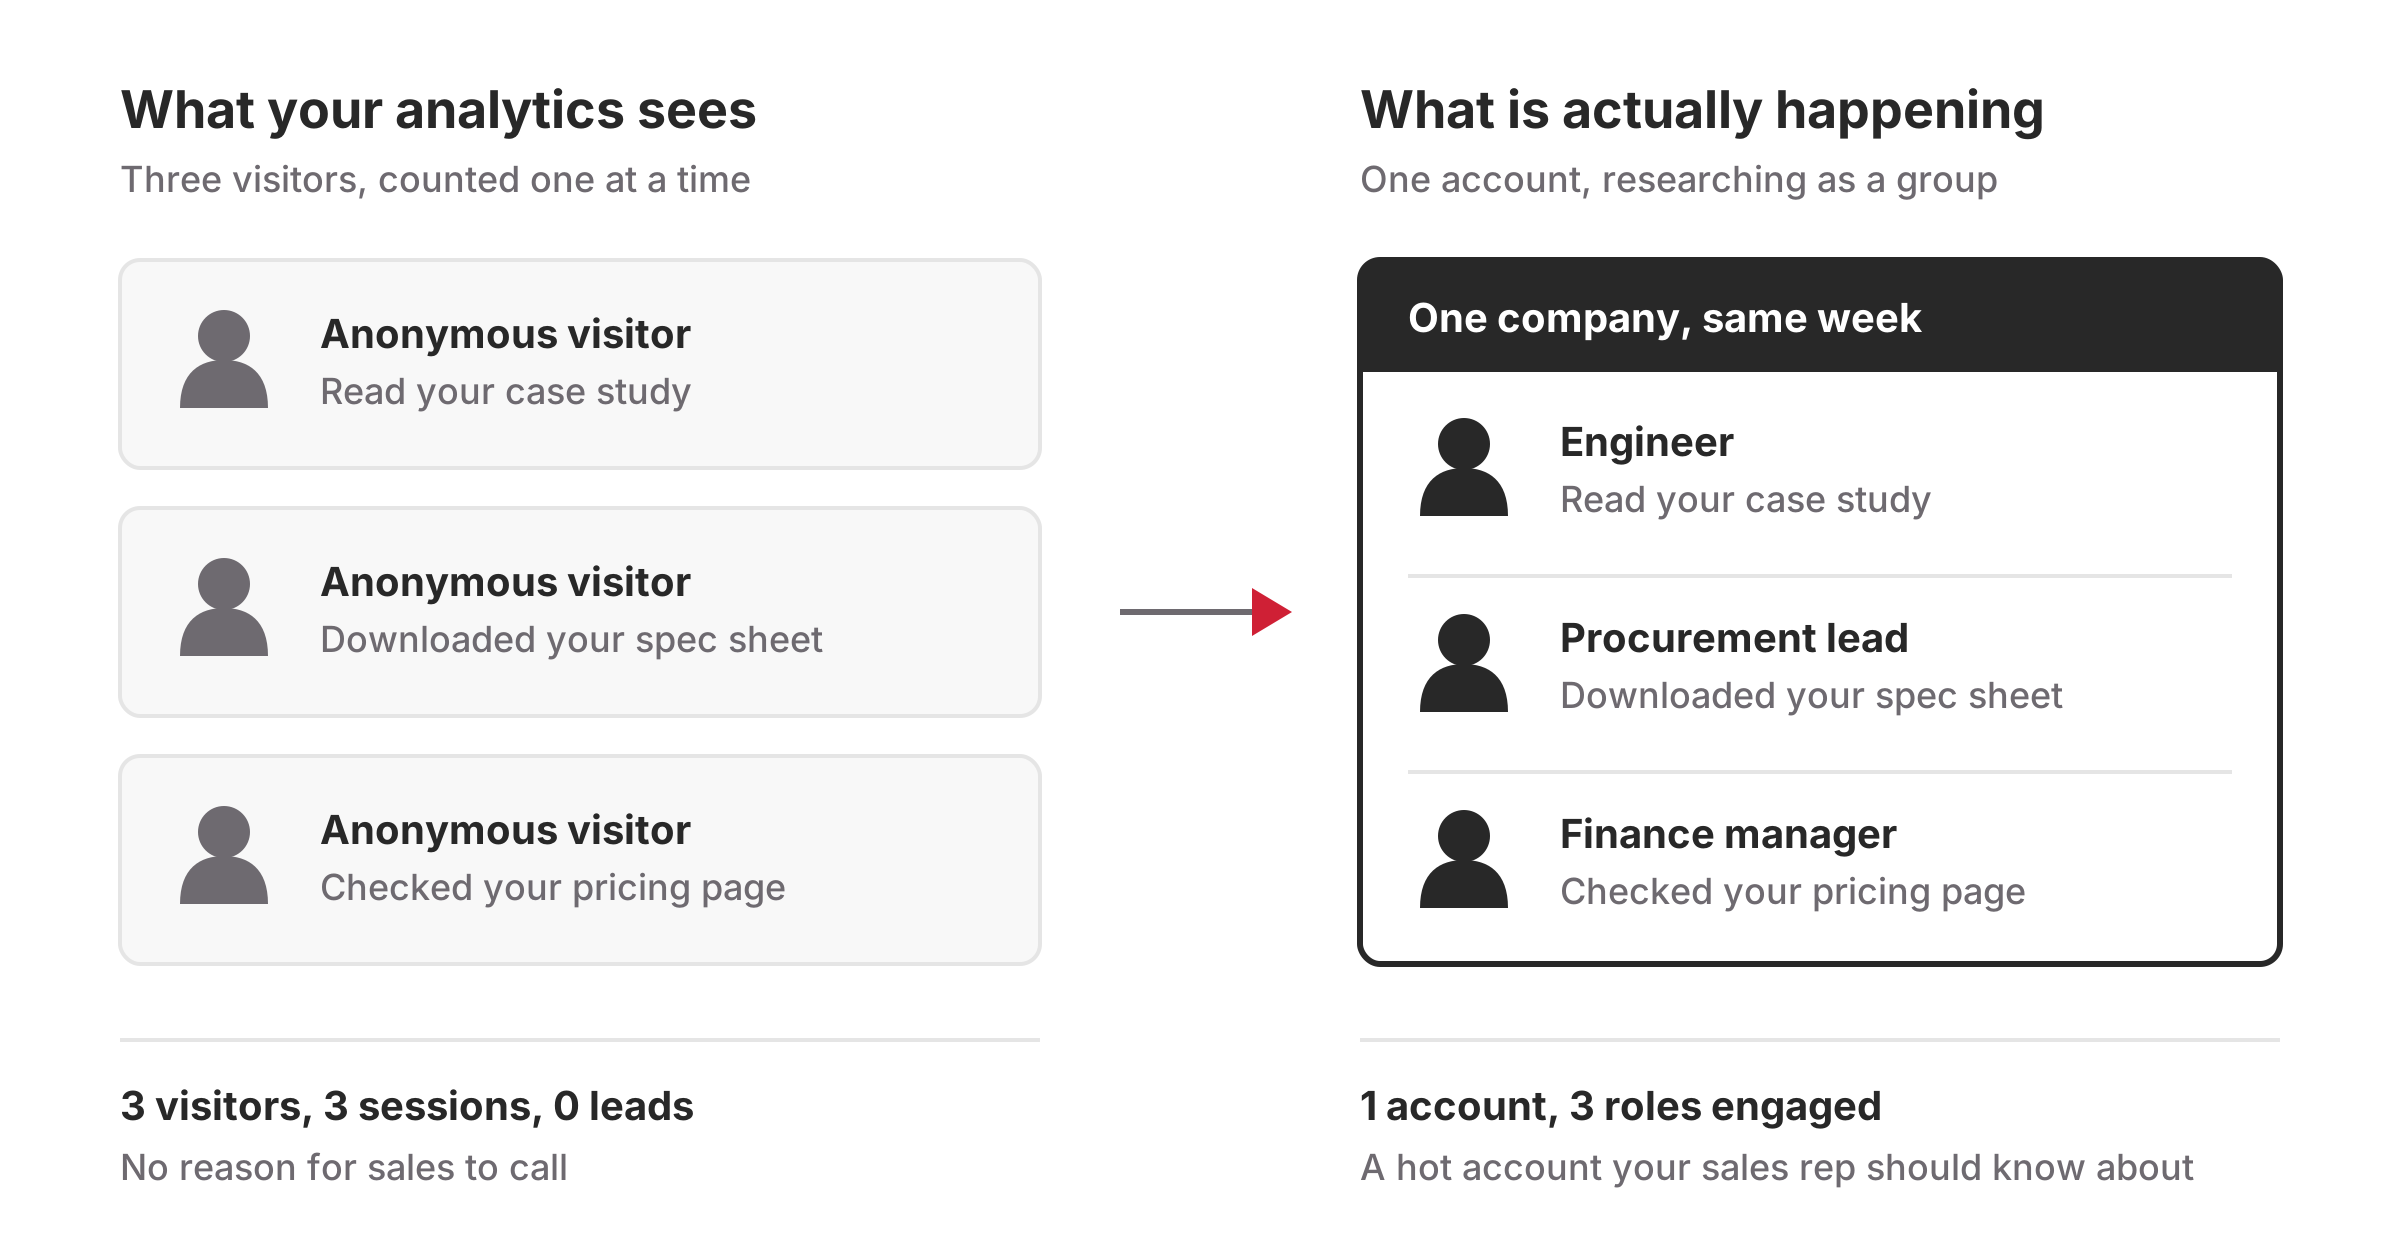
1. The unit of measurement is wrong. Analytics counts the visitors, and you sell to your accounts. When three people from one company read your case study, download your spec sheet, and check your pricing page in the same week, your analytics sees three strangers. Your sales rep, if they ever found out, would see a hot account.
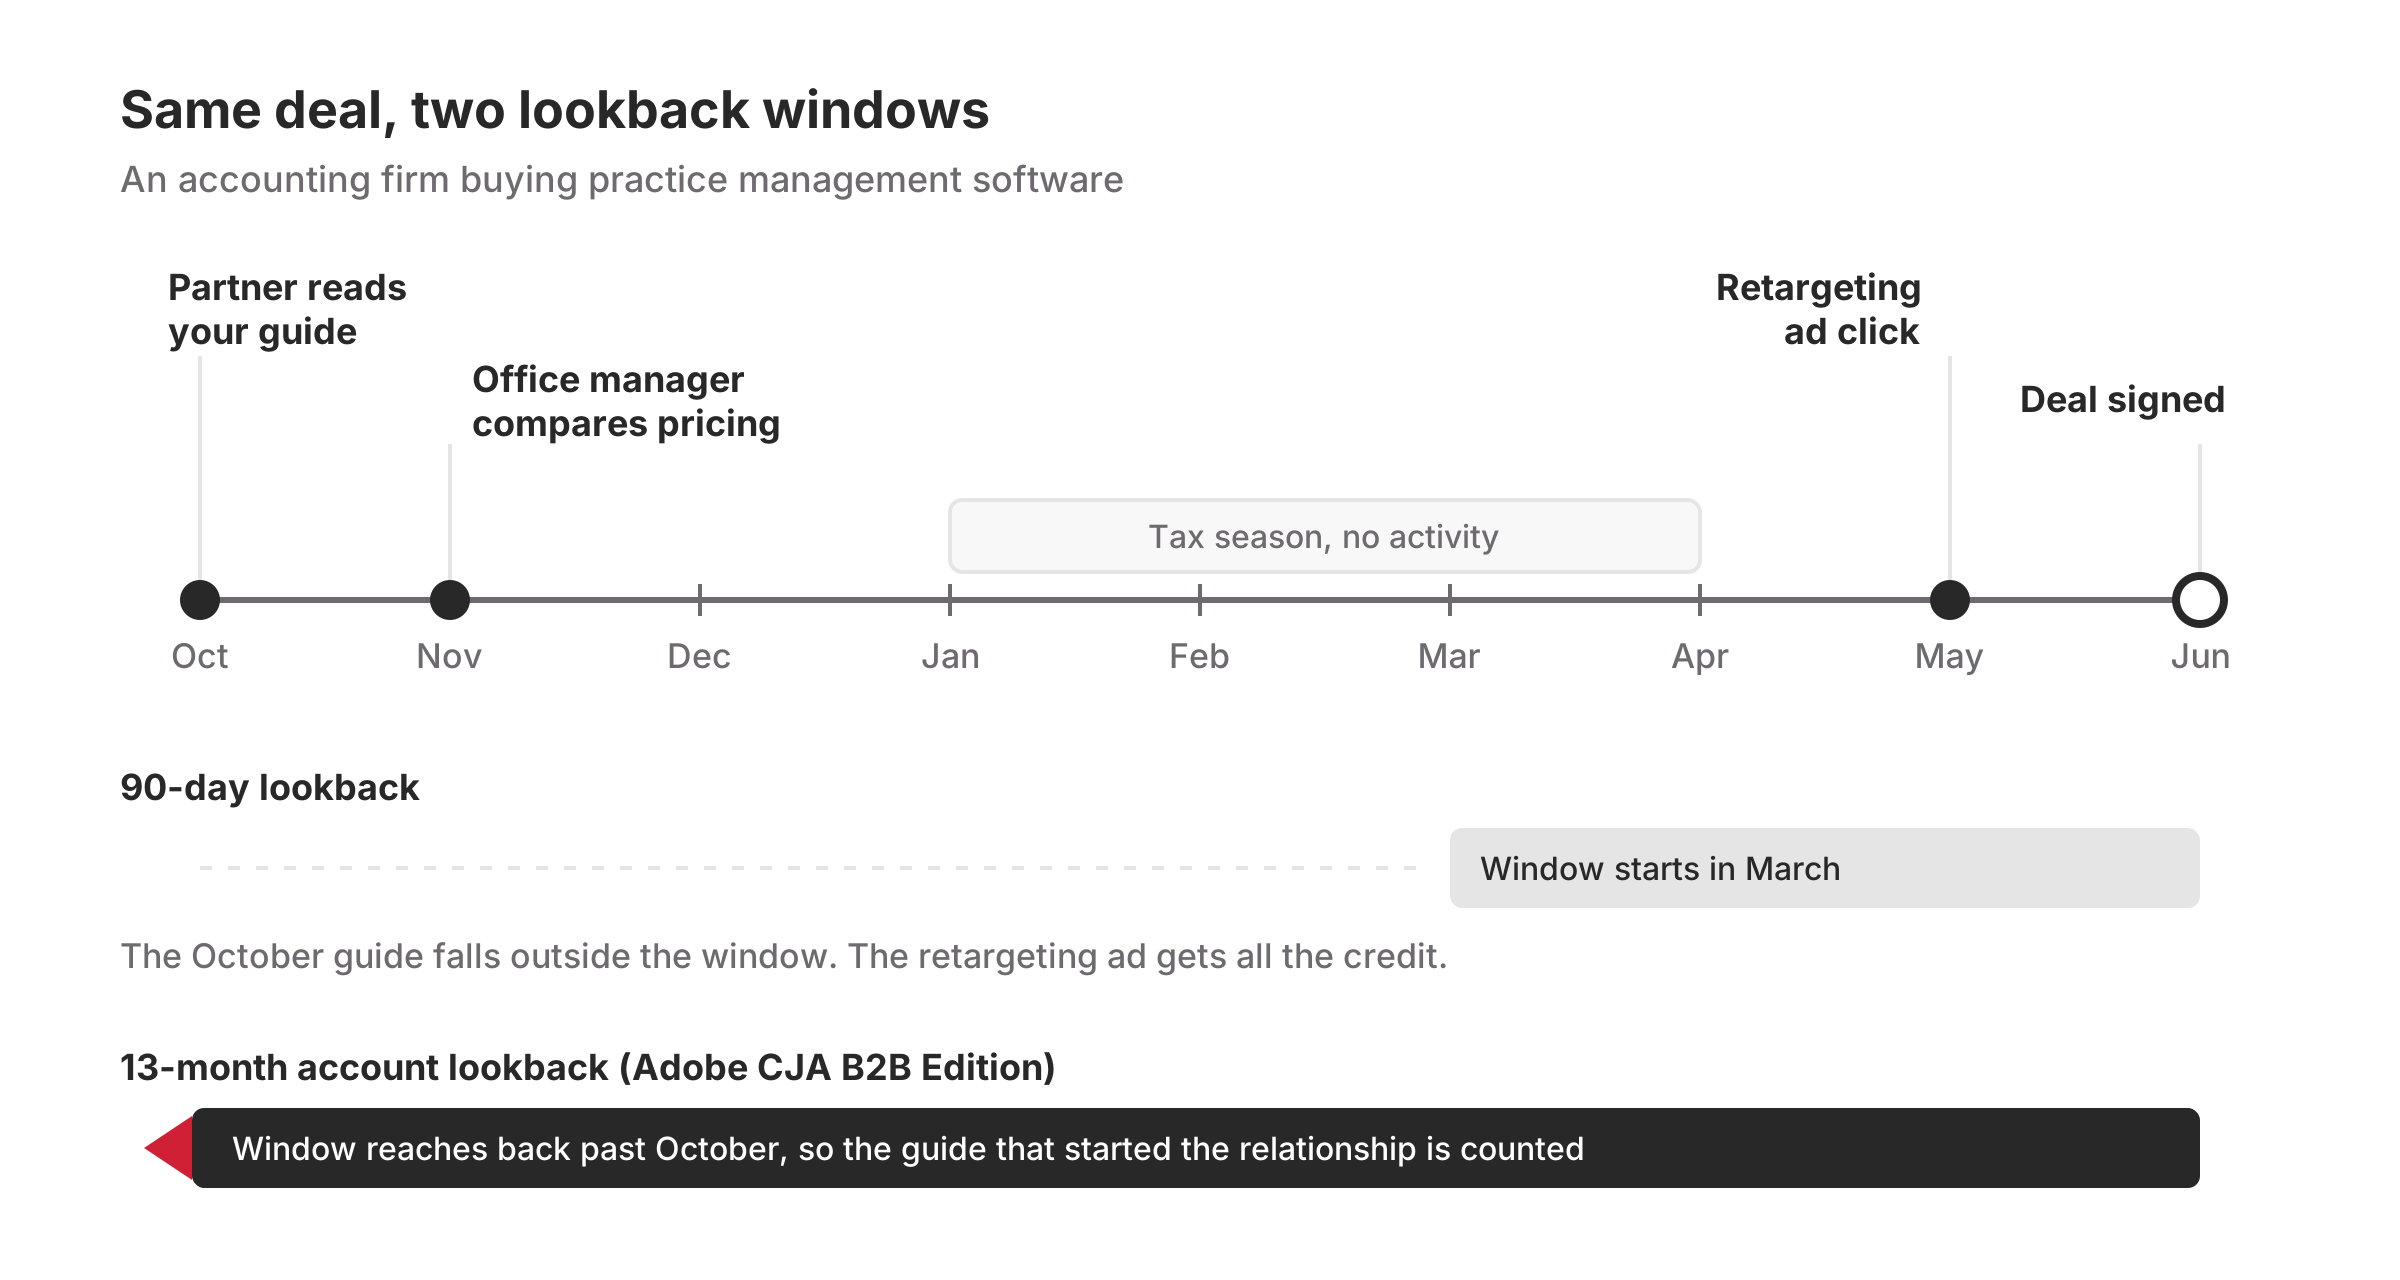
2. The clock is wrong. B2B sales cycles run from two weeks to two years. Most attribution lookback windows were built for someone who clicks on Tuesday and buys on Thursday. Imagine an accounting firm shopping for new practice management software. A partner reads your guide in October, and the office manager compares pricing in November. Then everyone disappears into tax season, and they sign in June. By then, a 90-day window has dropped the October visit, so the campaign that started the relationship gets no credit and the last retargeting ad gets all of it.
3. Buying runs well past your website. Your potential customer may come from LinkedIn, paid search, email nurtures, webinars, trade shows, podcasts, sales calls, and procurement reviews. In most organizations, the CRM, web analytics, email platform, and paid media don't talk to each other.
4. Nobody agrees on the definitions. What counts as a marketing qualified lead (MQL), and when does it become a sales qualified lead (SQL)? Does pipeline count as "influenced" because one person at the account opened a single email? If marketing, sales, and finance answer differently, no tool on earth will produce numbers they all trust. Most companies tend to skip this one, and it sinks more analytics investments than the other three.
Three B2B analytics challenges and how to fix them
We pulled together the ten B2B analytics challenges that come up most often into a free playbook (coming soon!). Here are three of them to give you a feel for it.
Most of the buying journey happens before anyone fills out a form
By the time someone requests a demo, they've likely been researching for weeks or months, much of it on your site and all of it anonymous. Your analytics credits the form fill and treats everything before it as a black box.
Fixing it takes a chain with three links: a persistent first-party ID for every visitor, an identification moment where they tell you who they are, and a join from that known identity to your CRM contact and account. Miss one link and the chain breaks apart. And be honest about coverage. Plenty of researchers never identify themselves at all, which is why the smartest teams create more reasons to do so; think gated research worth the trade, webinar registrations, logged-in portals, and useful assessments. That's a content strategy decision as much as an analytics one.
One of our clients, an electronics components supplier, connected its reverse-IP tool to its analytics and set thresholds for how much content, and what kind, a company consumed. When an account crossed the line, sales got a daily alert listing what that company had read, with no form fill required. Sales found new opportunities, closed them quickly, and raised customer lifetime value.
Events, PR, and podcasts get filed under "brand" and never measured
Your company puts executives on stages, sponsors conferences, and books podcast appearances. Leadership believes it works. Finance asks for proof. Marketing produces impressions and booth scans, and everyone quietly agrees not to push further, until budget season.
You won't get clean click-based attribution for brand activity, and anyone who promises it is overselling. What you can do is measure influence. Get badge scans and attendance into your data with a date and an account attached. Compare what attending accounts did over the next 30, 60, and 90 days against similar accounts that didn't attend. Watch branded search and direct traffic from target accounts. And decide how you'll measure the event before the event, not after. That won't prove causation, but it will build a pattern finance can follow.
You can see one contact, but six to ten people are deciding
Your champion is engaged. They've attended webinars, opened every email, and taken three sales calls. The deal still dies, because their CFO never saw anything that addressed their concerns and IT security raised objections nobody saw coming. You were selling to one person while they were buying as a committee.
Lead-based systems score individuals, so a single enthusiastic champion looks the same as a fully engaged buying group. Solving it means defining the roles in a typical buying group for each offering, mapping contacts to those roles, and tracking which roles are engaged at each account. When teams run those numbers for the first time, most discover their "engaged accounts" are really "engaged individuals." That's not bad news. That's a roadmap for where your content and outreach gaps are.
How Adobe Customer Journey Analytics B2B Edition helps
Every one of these problems can be worked on in any analytics stack. But it's a whole lot easier when the analytics platform was built for accounts in the first place.
That's what Adobe Customer Journey Analytics B2B Edition was designed for. Instead of only counting people, sessions, and events, it adds an Account container, with optional Buying Group, Opportunity, and Global Account containers alongside it. (Adobe Experience League) Every web visit, email click, and event scan can roll up to the person, their account, their buying group, and the deal they're attached to. It also supports 13-month account lookback windows for multi-touch attribution, built with B2B cycles in mind. (Adobe Experience League)
Thirteen months is a big step up from 30 or 90 days. It also isn't two years. If your enterprise deals run 18 to 24 months, you still need to record the originating touch on the CRM record itself. I'd rather tell you that now than have you find out in a board meeting.
When the connections are in place, the payoff can come rather quickly. One financial services client used CJA B2B Edition audiences to stop showing awareness ads to people who had already moved on to a conversion campaign. In the first quarter, the savings alone were more than the cost of the CJA license.
It's not easy, quick, or cheap, and that's okay
I've been saying some version of this for years about every marketing channel worth doing well. Connecting your web, CRM, marketing automation, paid media, and event data takes real work, including a data model, identity rules, a data layer your web team builds, and QA that proves the numbers match your CRM. A focused launch can take six to eight weeks. A multi-property program with several connected data sources takes four to five months. And the biggest variable usually isn't the technology. It's whether your web development team has the capacity, and whether marketing, sales, and finance have agreed on what an MQL actually is.
That last part costs nothing but a few uncomfortable meetings. Start there.
Get the playbook and see it live
We're finishing the full playbook, Your Sales Cycle Isn't Just the Web Anymore: 10 B2B Analytics Challenges and How to Fix Them. Everyone who registers for our November 18 webinar gets a copy.
CJA for B2B: Your Analytics Challenges, Solved
Join me, Marijka Engel, and Shana Wasden from Adobe on Wednesday, November 18 at 1 p.m. ET. I'll walk through these challenges, then they'll show you CJA B2B Edition live. It's 30 minutes, plus Q&A.
Not sure where your team stands? The free B2B Analytics Readiness Assessment takes about 10 minutes. It scores how ready your definitions, CRM data, and team are for account-level analytics, then gives you your top three gaps and a recommended first step. On Adobe Analytics today? Northern's Migration Readiness Assessment scores how complex a move to CJA would be.
Take the readiness assessment · Take the migration assessment
Your buyers stopped acting like shoppers a long time ago. It's time your analytics caught up.
If your team is still stitching together spreadsheets to answer the pipeline question, we'd love to continue the conversation.
Frequently asked questions
What is B2B marketing analytics?
B2B marketing analytics measures how marketing activity turns into pipeline and revenue when you sell to other businesses. Because B2B purchases involve several people and long sales cycles, it tracks accounts and buying groups over months, not only individual visitors over days. It usually combines data from your website, CRM, marketing automation, paid media, and events.
What does last-click attribution mean?
Last-click attribution gives all the credit for a conversion to the final touchpoint before it, such as the last ad someone clicked. In B2B, a late retargeting ad can end up with full credit for a deal that started months earlier with a webinar, a guide, or a sales conversation.
What is multi-touch attribution?
Multi-touch attribution splits credit for a conversion across several touchpoints instead of giving it all to one. In B2B, it works best at the account level, with a lookback window long enough to cover the sales cycle. Adobe Customer Journey Analytics B2B Edition extends account lookbacks to 13 months.
How long is a B2B sales cycle?
It depends on deal size and how many people are involved. B2B sales cycles can run anywhere from two weeks to two years. According to Gartner, a typical complex B2B purchase involves six to ten decision makers.
What is Customer Journey Analytics?
Adobe Customer Journey Analytics (CJA) is Adobe's analytics application that uses Analysis Workspace with data from Adobe Experience Platform. It can combine data from online properties, call centers, and point-of-sale systems into a single reporting view. CJA B2B Edition adds an Account container, with optional Buying Group and Opportunity containers, for account-level reporting.
Stay informed, sign up for our newsletter.