Get Started With GA4: What Are Explorations?
Summary
With Google planning to sunset Universal Analytics in July 2023, the move to Google Analytics 4 is imminent. Users may have noticed that GA4 has fewer standard reports compared to Universal Analytics, however, many of these new report types are a good starting point for gathering deeper insights. They are designed to be highly interactive, with visualizations that make it easier to understand and identify trends and patterns in your data. You can use Exploration reports to see how visitors are interacting with your website or app, such as which pages they are visiting and where they most often navigate from each page. These reports are also beneficial for viewing user segmentation data to understand who is coming to the platform by location, device, or channel, or to see whether your marketing campaigns are gaining traction.
How to get the most out of every type of GA4 report.
On
Need to know
GA4 Exploration reports have several benefits including:
- Customizable and interactive analytics, with options to filter, group, and drill down into specific data points
- Data consolidation, which provides a deeper understanding of performance across all data points
- A user-friendly interface, which is easy to use to navigate and explore data — even if you’re not an expert
What are explorations?
GA4 Explorations are reports that allow users to uncover deeper insights than ever before. The Google Analytics 4 property gives you the ability to track events across platforms and devices so that for the first time, you can see the whole picture of your customer journey in one place. You can learn more about the switch from Universal Analytics to GA4 here.
How do I use explorations?
Explorations can be started from a template in GA4 or a blank canvas. The various report types and their uses are summarized below:
Right
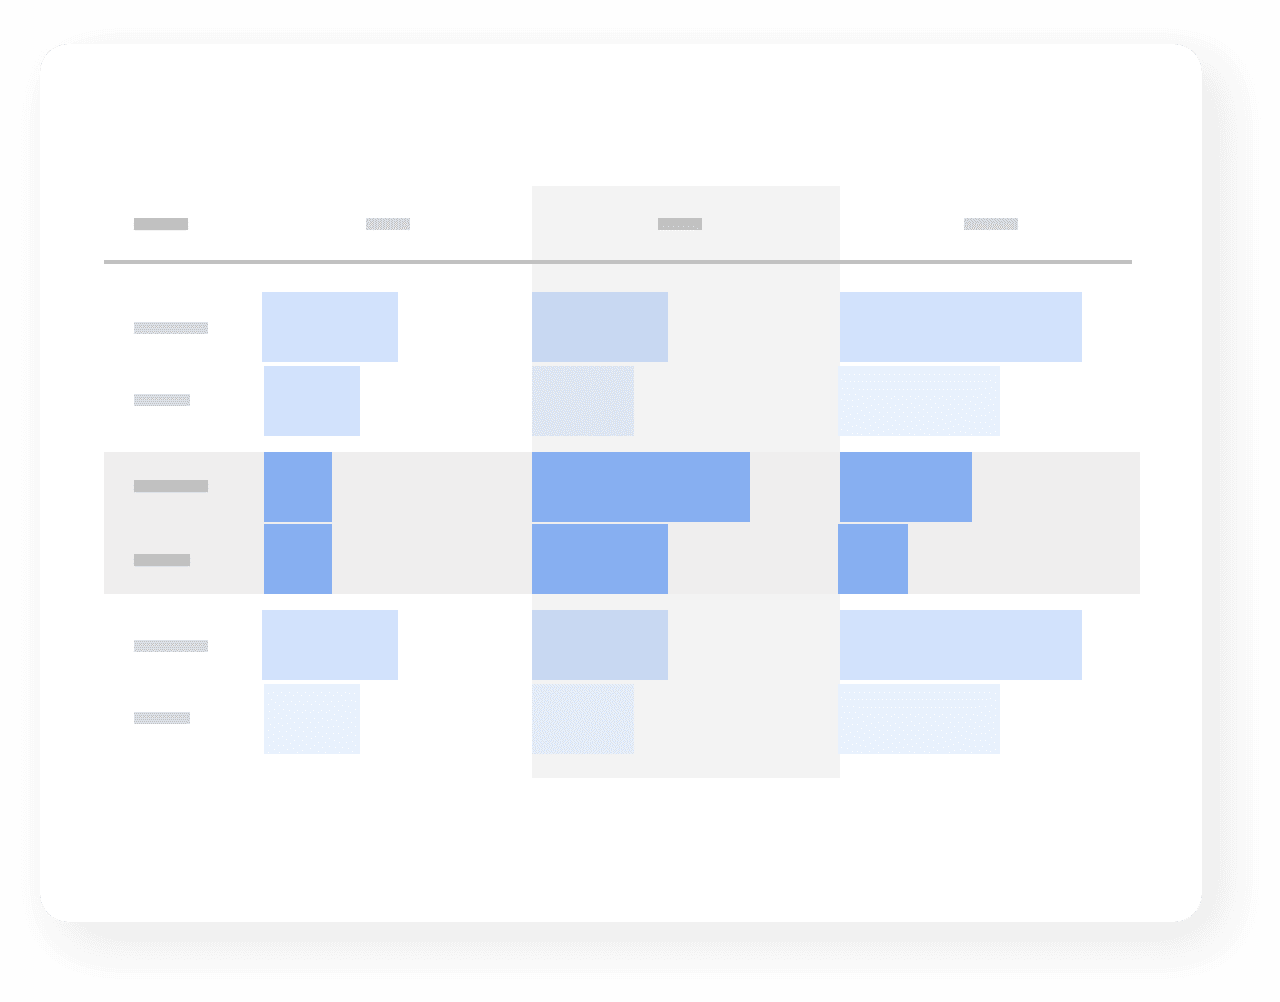
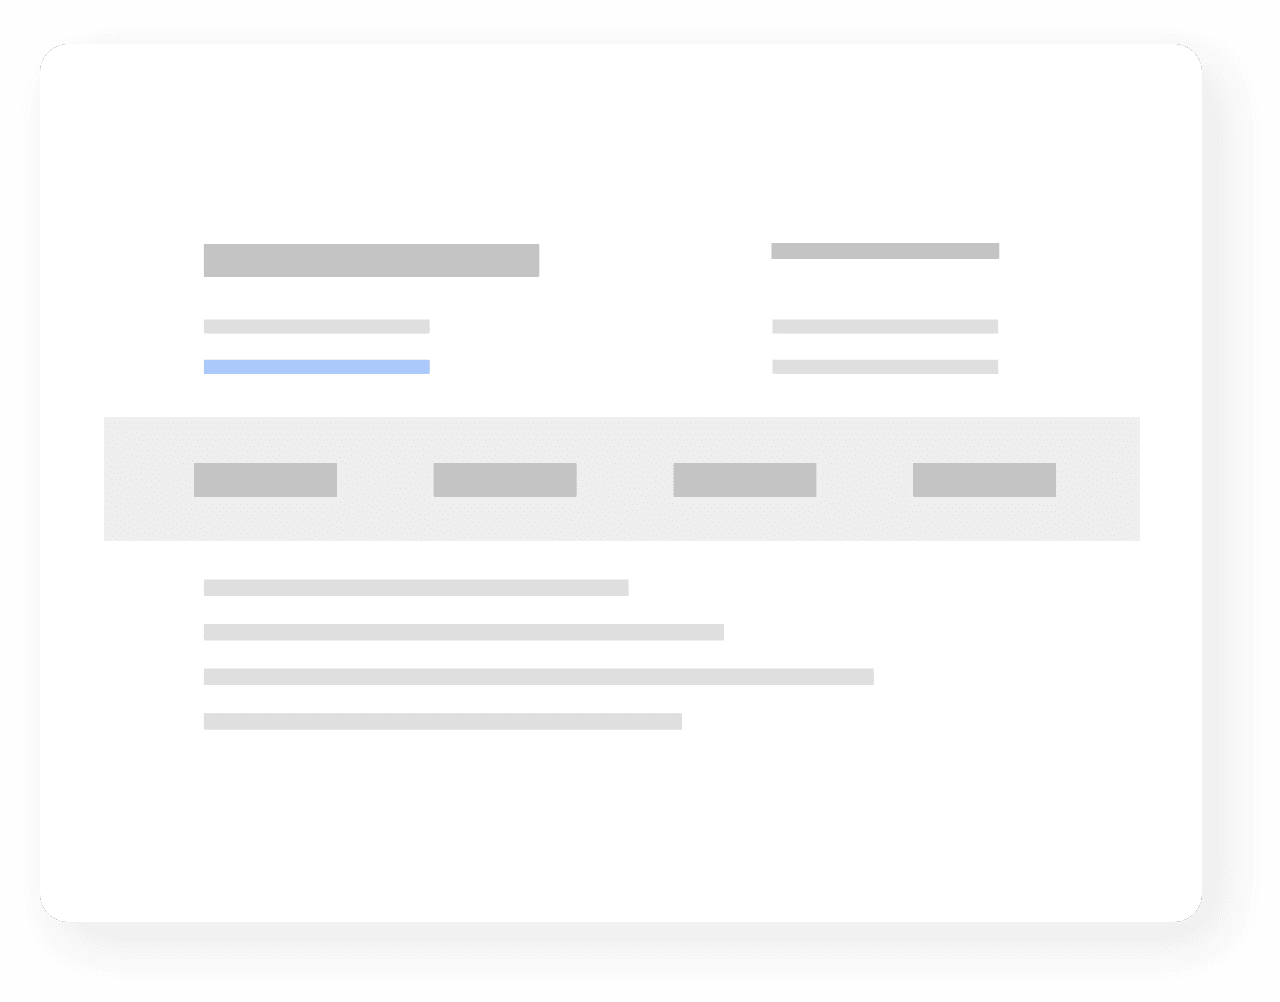
Free-form: This flexible report allows you to visualize your data in various graphs and tables, using a predefined set of metrics, dimensions, and segments. You can customize this exploration by applying filters and other modifications, and by arranging rows and columns to compare your metrics against one another.
Useful for: Visual comparison between related data points. For example, exploring the relationship between the device type your users are visiting from and their screen resolution, sorted by country.
Left
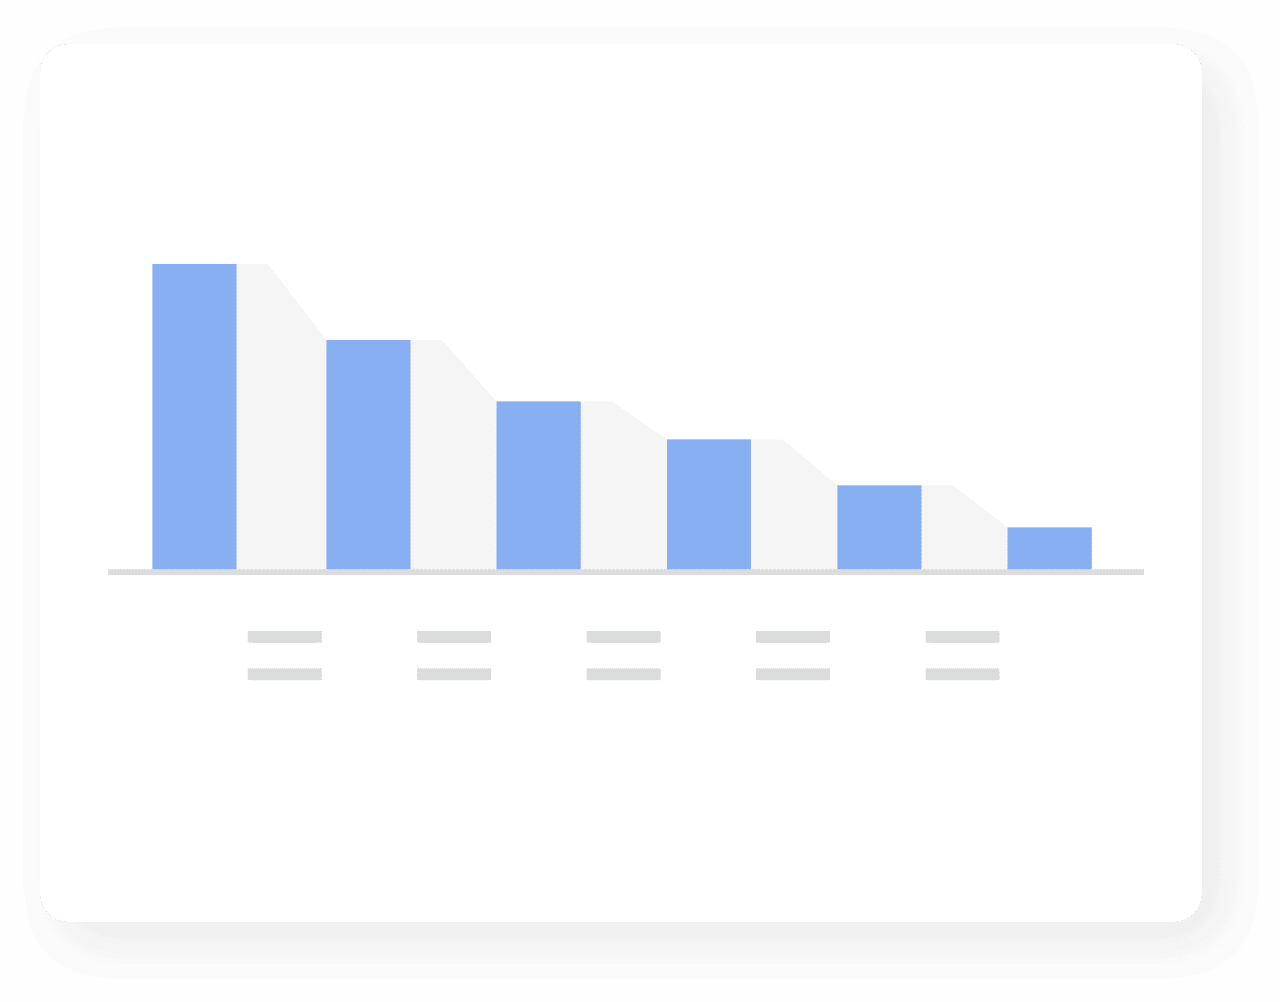
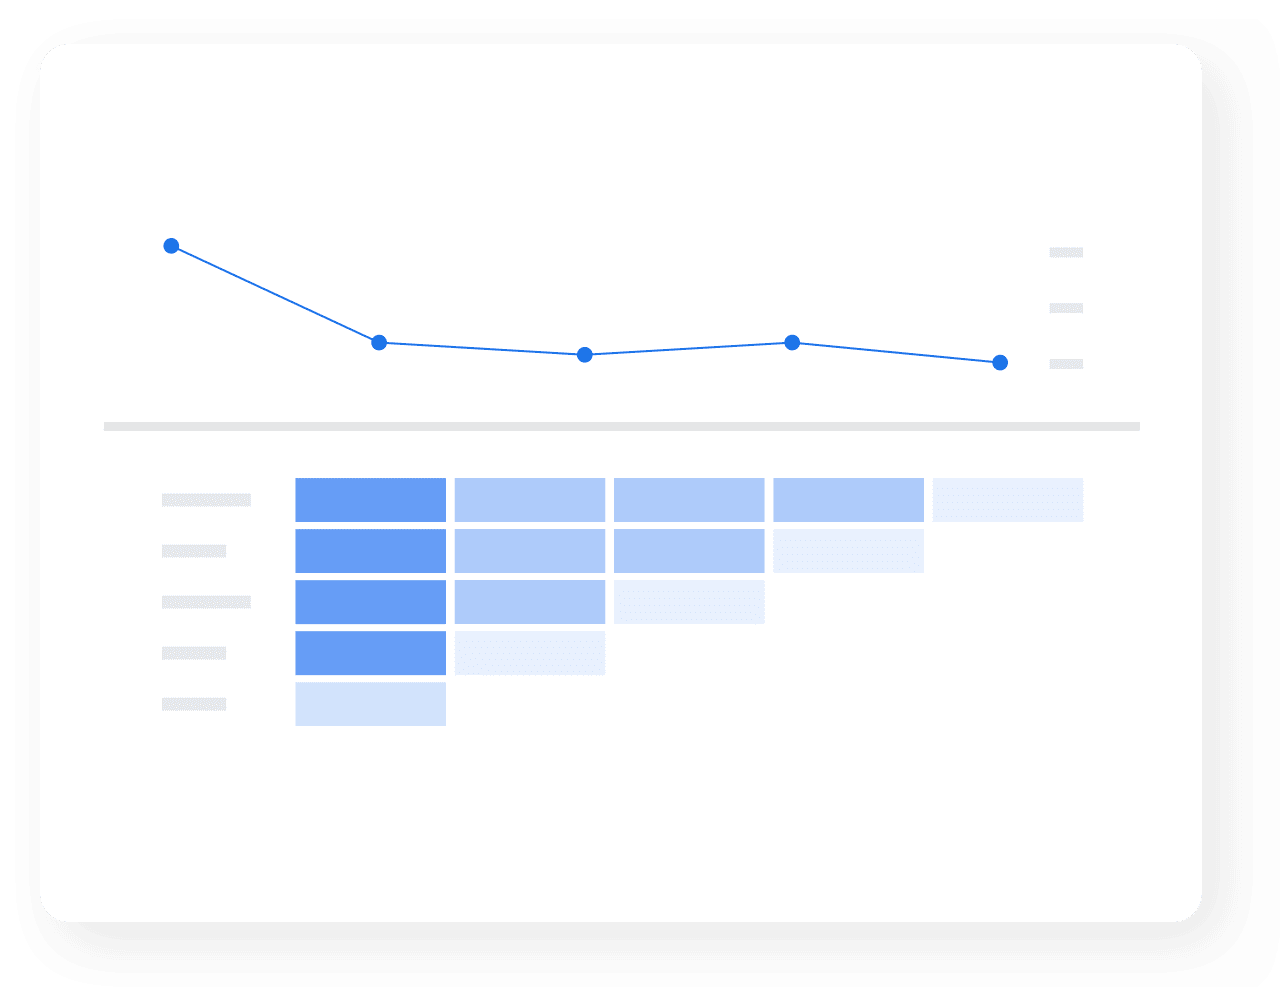
Funnel exploration: You can use this exploration to visualize the steps users take in a task, such as when using a checkout, funnel, or lead generation form. If users are dropping off before completing one of these tasks, funnel explorations allow you to identify where users are failing to make improvements and increase conversion rates.
Useful for: Understanding user experience and optimizing your platform to decrease drop-off. For example, an eCommerce site can use this exploration to see how their prospects become buyers to inform improvements for abandoned customer journeys.
Right
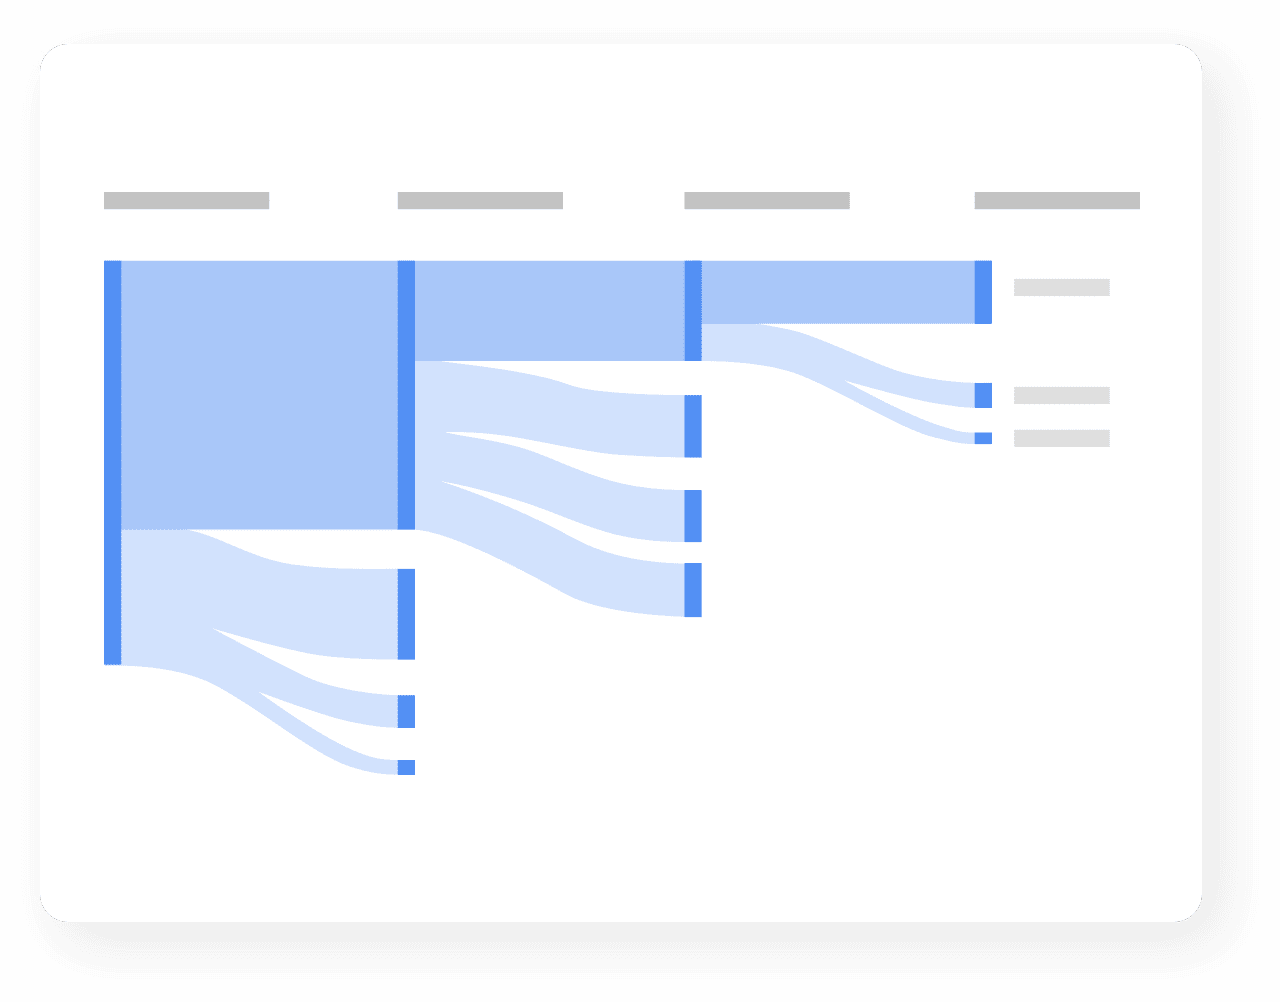
Path exploration: By default, this template is pre-populated to display how users navigate after the session_start event. This exploration gives you insight into user journeys using a tree graph format which allows you to visualize the pages new users navigate to after opening your home page. Each event is displayed as a node, and you can follow a specific user path by clicking on each one individually.
Useful for: Analyzing user behaviour to better understand their experience on your platform — for example, to see whether people are returning to previous pages or if they appear confused or stuck in a loop — and optimizing accordingly. This can lead to other forms of research like heatmaps, and session recordings which can complement analytics data.
Left
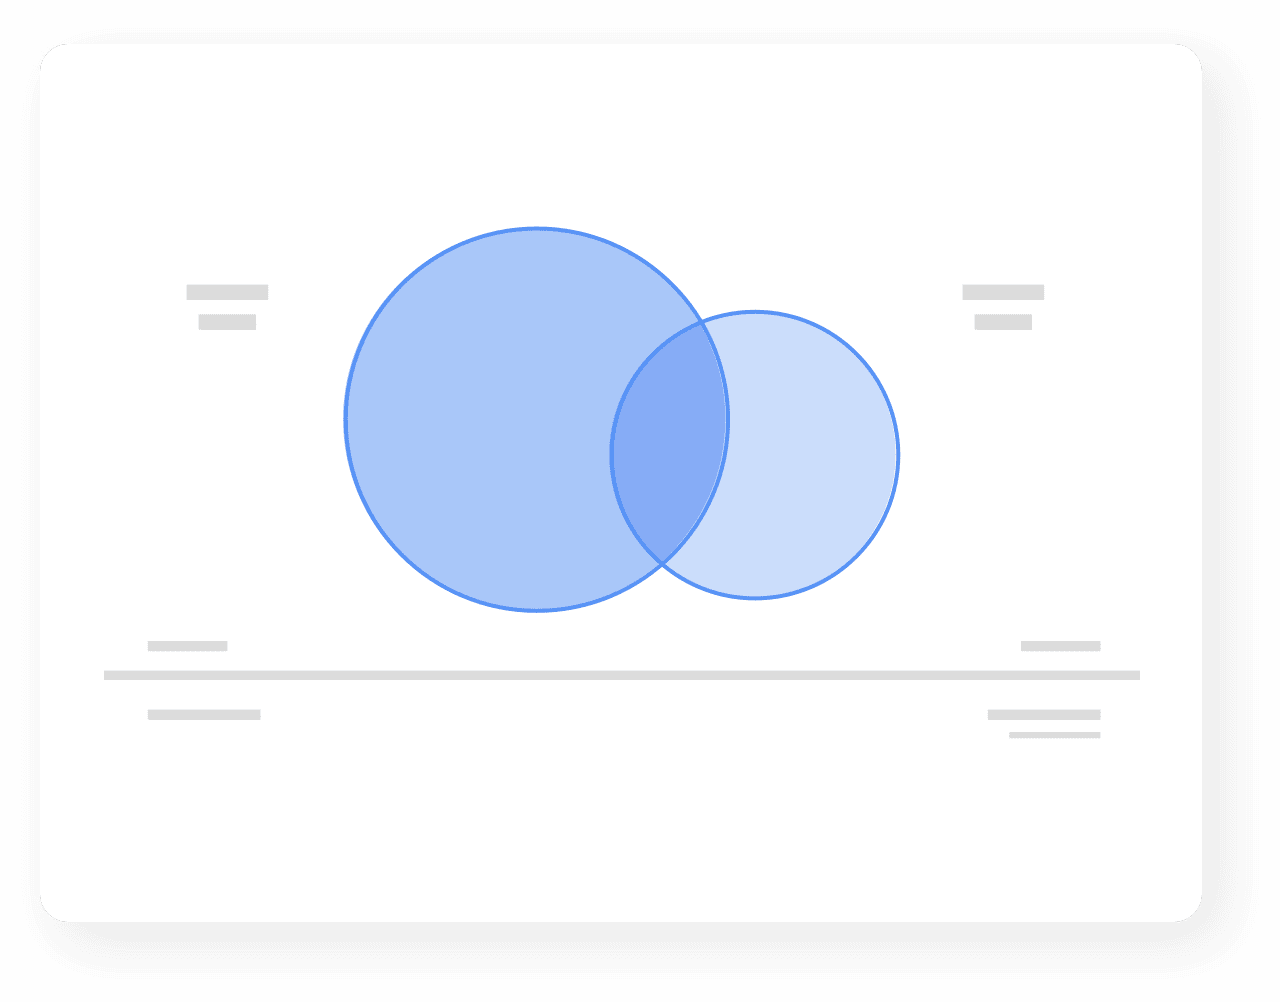
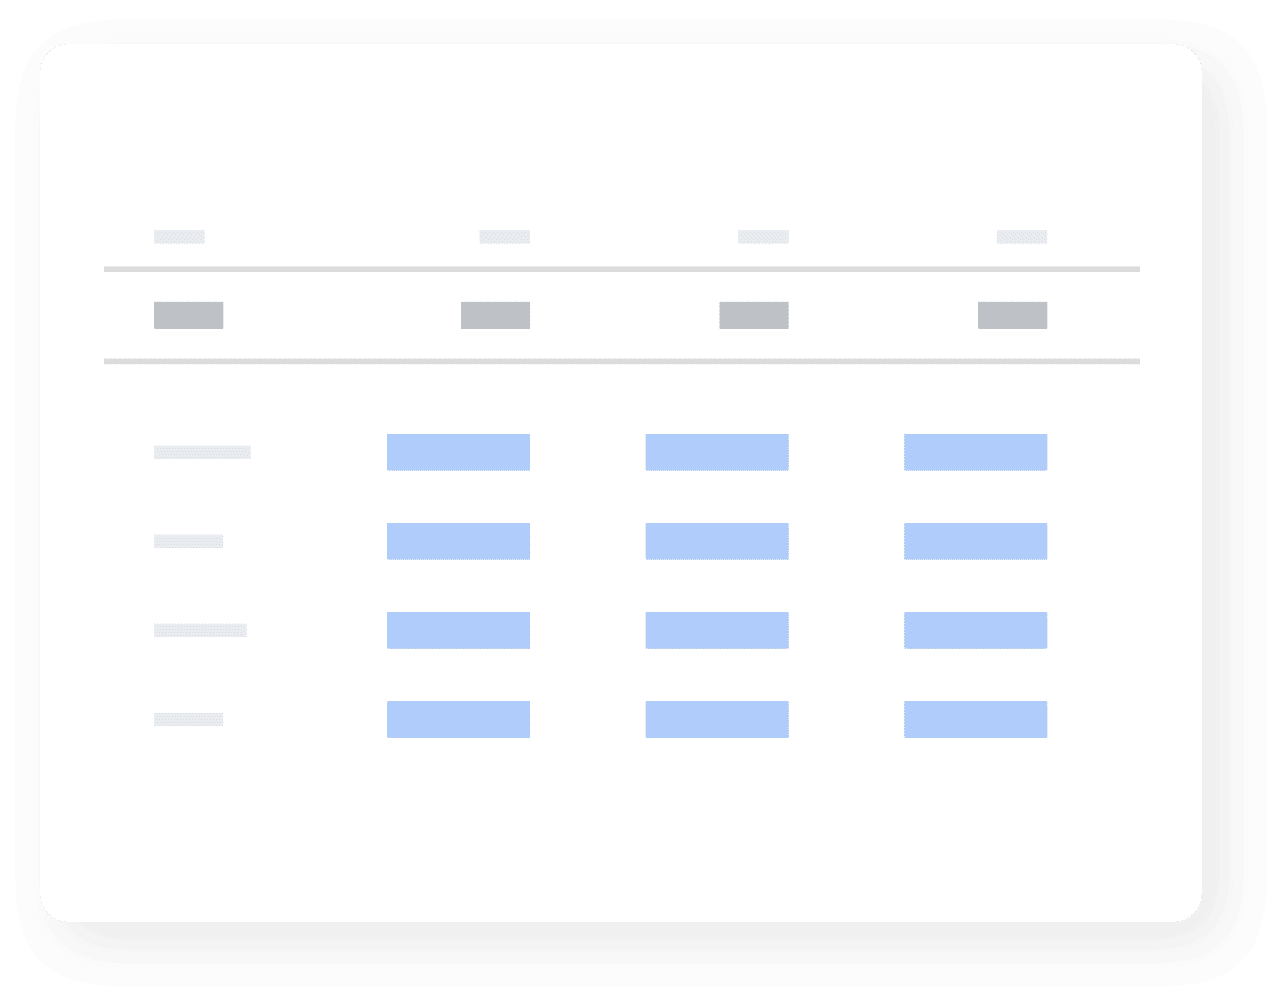
Segment overlap: Also pre-populated by default, segment overlap explorations allow you to identify how user segments relate and compare to each other. You can add, remove, or exchange segments to display up to three groupings and see how they overlap.
Useful for: Analyzing user behaviour based on specified parameters such as gender and location. You can then use your findings to create new segments which can be applied to other explorations for deeper insights.
Right
User exploration: Helps you analyze data from a segment of users who fit specific criteria and view individual user activities. This report can be used to look into the behaviours of unique users to gain insights that can be applied to your overall user experience.
Useful for: Personalizing user experiences and troubleshooting flow issues. For example, you can learn more about a user with a higher-than-average order value, or who abandoned their cart halfway through an order.
Left
Cohort exploration: Allows you to group users together into a cohort based on common qualities, in order to compare and contrast user behaviours over time on your platform.
Useful for: Identifying user trends and differences. For example, you can assign all users who visited your website for the first time on the same date to a cohort, to uncover deeper insights about user acquisition.
Right
User lifetime: A valuable template for looking into the entire lifetime of individual users since their first visit. This report also uses machine learning to predict the likelihood of future activities such as purchases.
Useful for: Finding specific insights such as how active campaigns are attracting different types of users, and insights into their behaviour, like which sources drove users to their highest lifetime purchases.
Blank template: GA4 also gives you the ability to build your own exploration by dragging and dropping metrics, dimensions, and segments onto the canvas.
Useful for: Creating a custom template by combining the features of existing GA4 templates to uncover deeper insights that are specific to your platform.
GA4 Explorations are powerful tools for gaining insight into your data, in a way that wasn’t possible with Universal Analytics. From identifying trends in customer behaviour for eCommerce sites to optimizing marketing campaigns for public sector institutions, these reports can be used in various ways to help make sense of complex information.
Ready to start driving conversions with Google Analytics 4?
Contact Northern today to be connected to our team of experts.
Stay informed, sign up for our newsletter.