Data Visualization Solutions: Make Complex Data Clear and Actionable
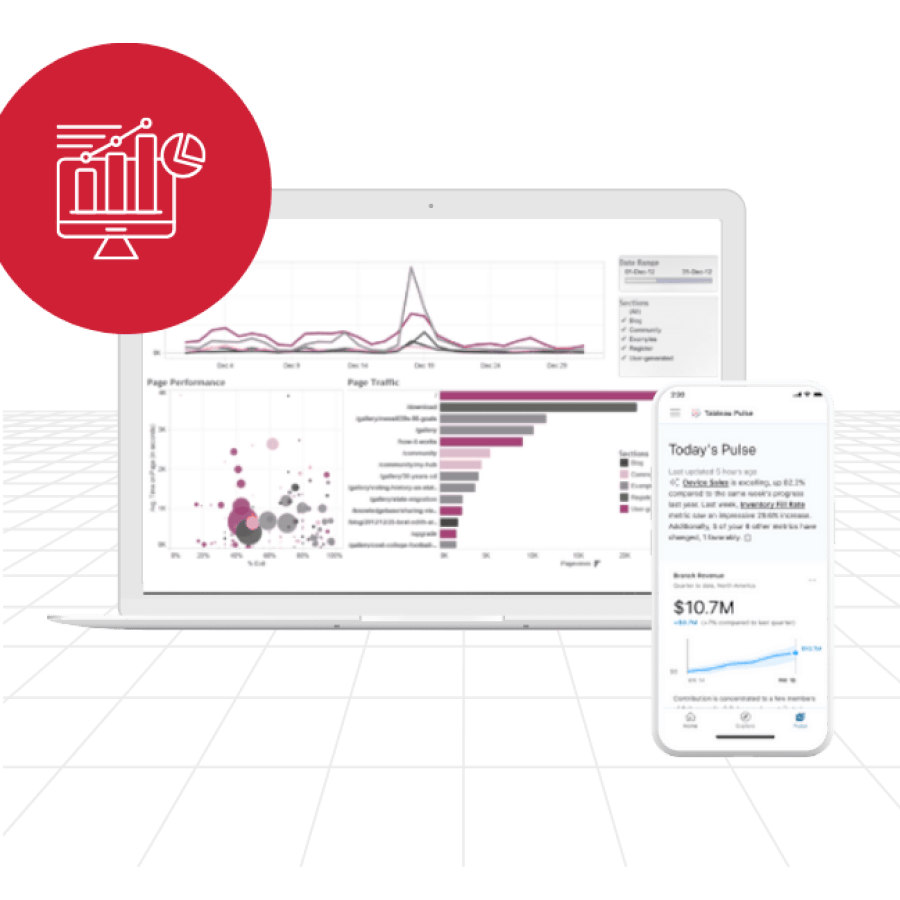
Having data is one thing—making sense of it is another. Our Data Visualization services help transform complex data sets into clear, interactive dashboards and visual reports that drive informed decision-making. From real-time analytics to custom visualizations, we design experiences that help teams see what matters, when it matters.
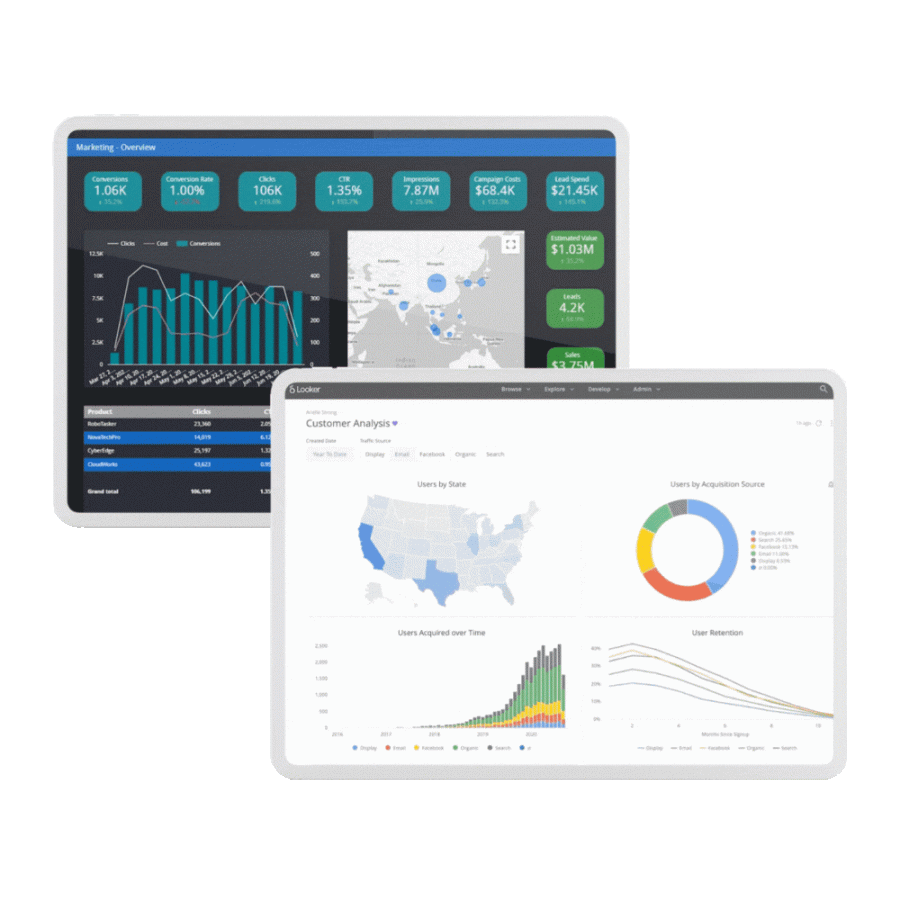
Trusted Experts in Data Visualization
Connect with a Data Visualization Expert to Bring Clarity to Business Data
Work with our team to turn data into actionable insight through intuitive design and strategic storytelling.
- Speak with a data visualization expert who specializes in transforming complex datasets into interactive, business-ready visuals.
- Discuss your reporting needs and explore how custom dashboards can surface the metrics that matter most.
- Review case studies to learn how we’ve helped organizations optimize performance and decision-making through visualization.
- Get pricing details—from discovery to design, implementation, and long-term support.
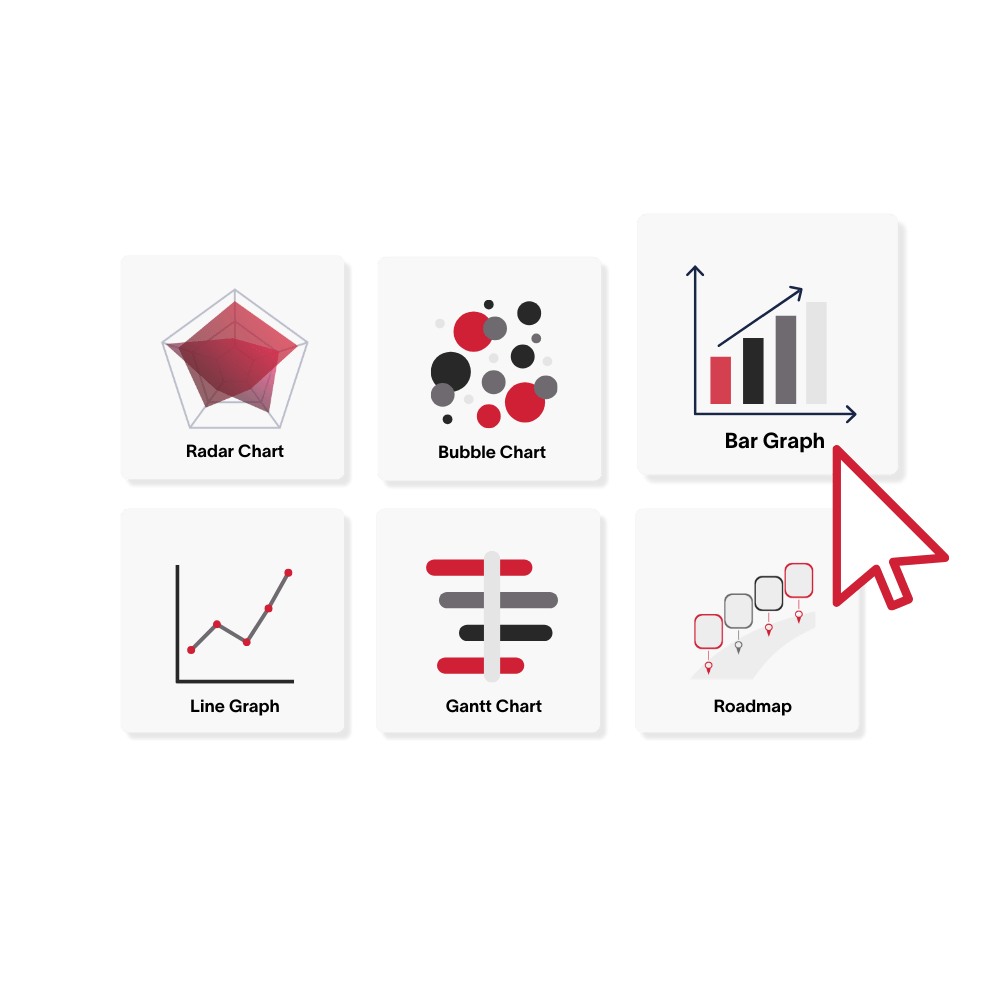
Visualization Strategy and User-Focused Design
We begin by understanding the business goals, data environment, and user needs. From there, we create dashboards and reporting tools that are easy to navigate and designed to support smarter, faster decision-making.
- Data Needs Analysis & Strategy
- Custom Dashboard Design & Development
- User Experience (UX) Focused Design
- Data Integration from Multiple Sources
Real-Time Dashboards for Agile Decisions
Stay informed with real-time data visualization that supports day-to-day operations and long-term strategy. Our solutions integrate seamlessly with existing systems, offering reliable insights when they’re needed most.
- Real-Time Data Integration & Syncing
- Automated Reporting
- Cross-Platform Visualization
- Ongoing Support & Training
Chat with one of our Data Visualization Experts
Speak directly with one of our experts who specializes in data visualization solutions.

Advanced Visualization for Deeper Insights
Move beyond static reports. We help organizations bring data to life with advanced analytics, interactivity, and predictive features—driving decisions that scale with the business.
- Predictive Analytics & Modelling
- Custom Visualization Tools
- Interactive Dashboards & Drill-Down Views
- Performance Metrics & Continuous Optimization